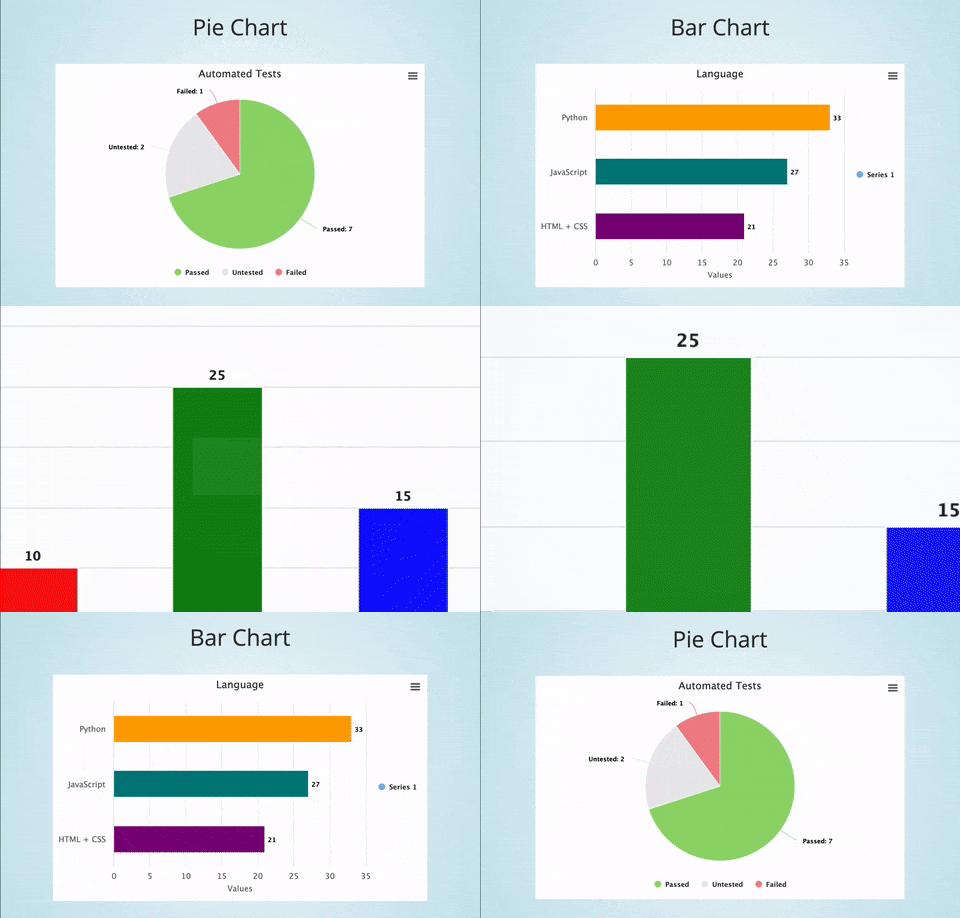
SeleniumBase ChartMaker lets you use Python to generate HTML charts.
(Click to see a presentation with multiple charts)
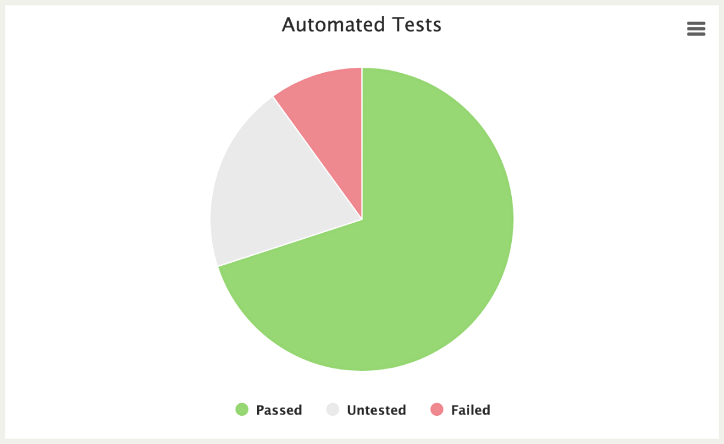
Here's how to run a simple pie chart presentation from GitHub => seleniumbase/SeleniumBase/examples/chart_maker:
cd examples/chart_maker
pytest my_chart.py
Here's the code for that pie chart presentation (GitHub => seleniumbase/SeleniumBase/examples/chart_maker/my_chart.py):
from seleniumbase import BaseCase
BaseCase.main(__name__, __file__)

class MyChartMakerClass(BaseCase):
    def test_chart_maker(self):
        self.create_presentation()
        self.create_pie_chart(title="Automated Tests")
        self.add_data_point("Passed", 7, color="#95d96f")
        self.add_data_point("Untested", 2, color="#eaeaea")
        self.add_data_point("Failed", 1, color="#f1888f")
        self.add_slide("<p>Pie Chart</p>" + self.extract_chart())
        self.begin_presentation(filename="my_chart.html")
Here's how to run an example presentation with multiple charts:
cd examples/chart_maker
pytest chart_presentation.py
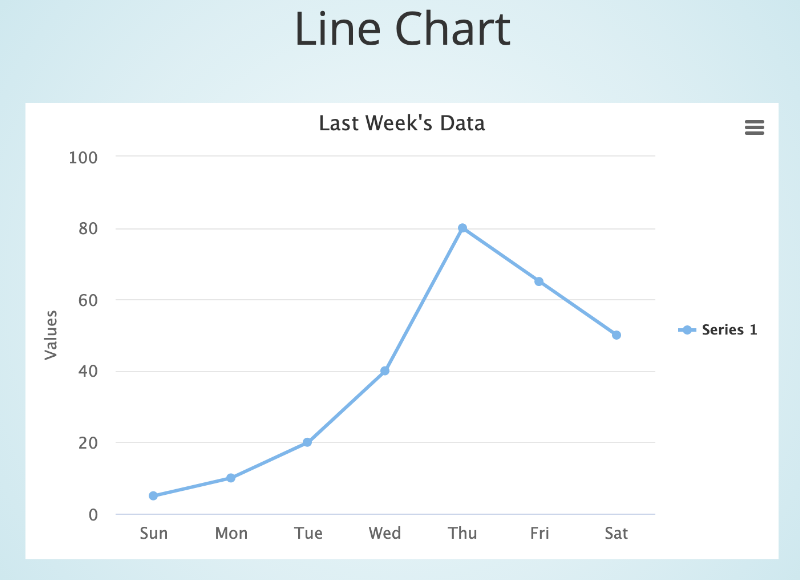
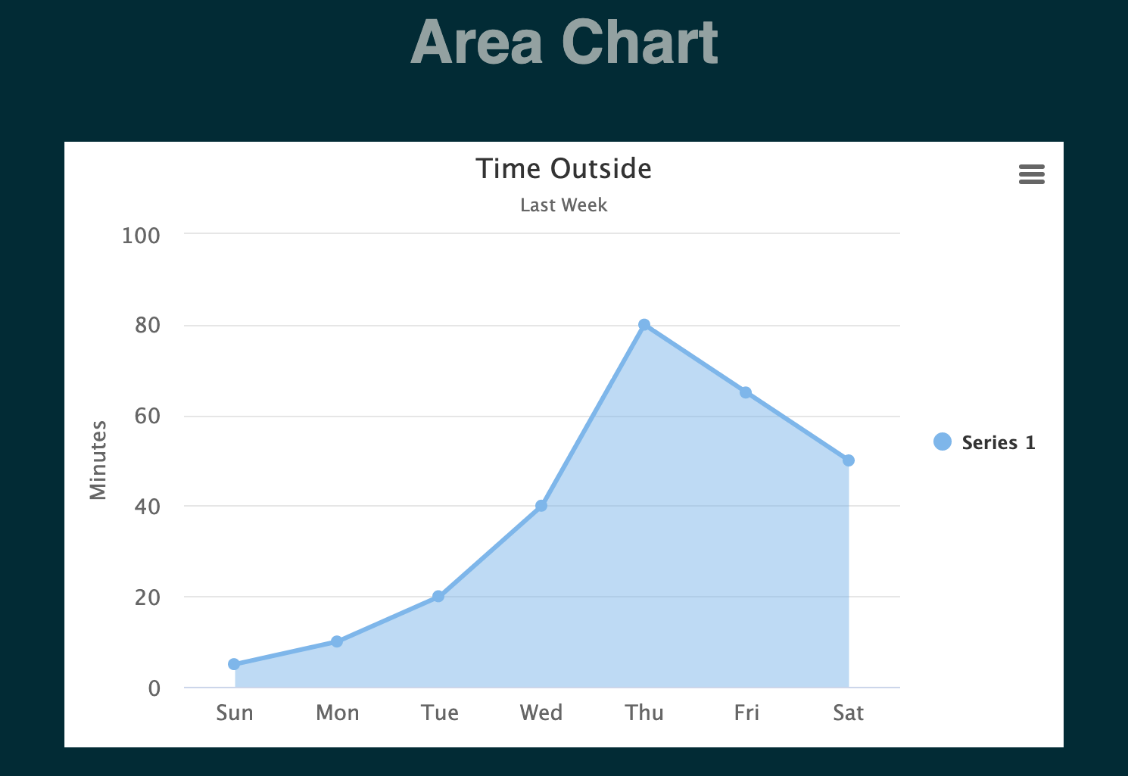
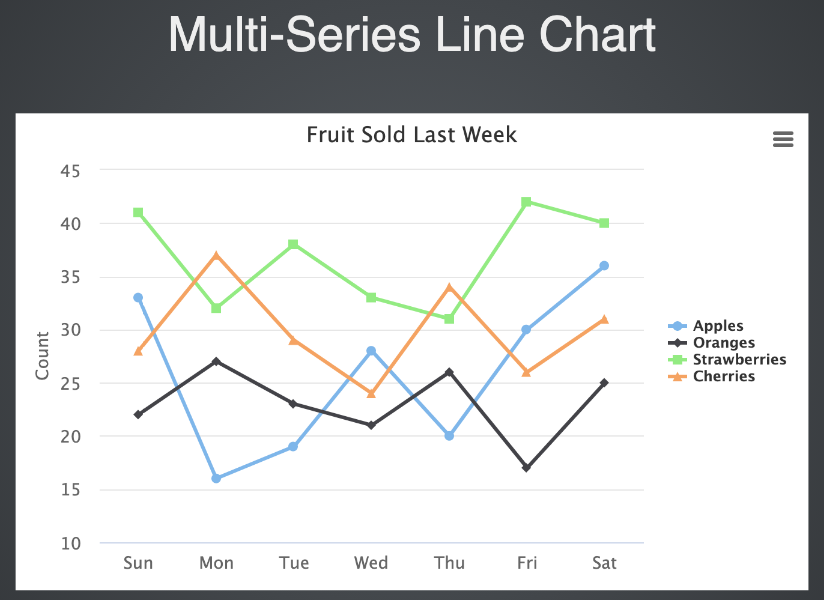
Here are screenshots from the examples:
from seleniumbase import BaseCase
BaseCase.main(__name__, __file__)

class MyChartMakerClass(BaseCase):
    def test_chart_maker(self):
        self.create_presentation()
        self.create_line_chart(
            title="Time Outside", subtitle="Last Week", unit="Minutes")
        self.add_data_point("Sun", 5)
        self.add_data_point("Mon", 10)
        self.add_data_point("Tue", 20)
        self.add_data_point("Wed", 40)
        self.add_data_point("Thu", 80)
        self.add_data_point("Fri", 65)
        self.add_data_point("Sat", 50)
        self.add_slide("<p>Line Chart</p>" + self.extract_chart())
        self.begin_presentation(filename="line_chart.html", interval=8)
This example is from test_line_chart.py, which you can run from the examples/chart_maker folder with the following command:
pytest test_line_chart.pyBecause that presentation above has an interval set to 8, it will automatically advance to the next slide after 8 seconds. (Or exit if there are no more slides.)
from seleniumbase import BaseCase
BaseCase.main(__name__, __file__)

class MyChartMakerClass(BaseCase):
    def test_chart_maker_presentation(self):
        self.create_presentation(theme="sky")

        self.create_pie_chart(title="Automated Tests")
        self.add_data_point("Passed", 7, color="#95d96f")
        self.add_data_point("Untested", 2, color="#eaeaea")
        self.add_data_point("Failed", 1, color="#f1888f")
        self.add_slide("<p>Pie Chart</p>" + self.extract_chart())

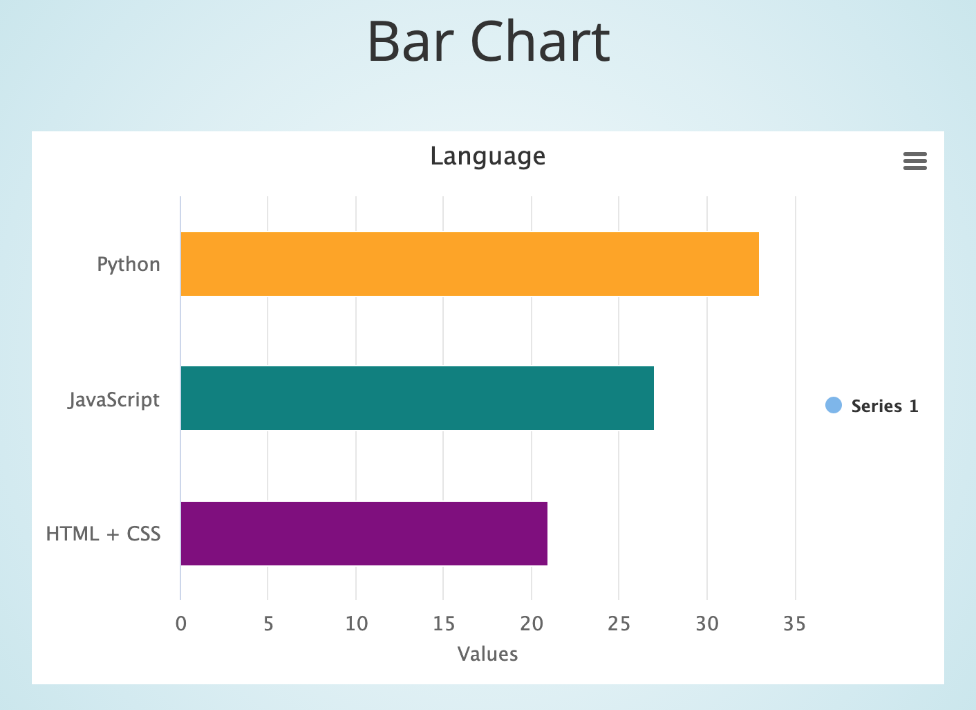
        self.create_bar_chart(title="Language")
        self.add_data_point("Python", 33, color="Orange")
        self.add_data_point("JavaScript", 27, color="Teal")
        self.add_data_point("HTML + CSS", 21, color="Purple")
        self.add_slide("<p>Bar Chart</p>" + self.extract_chart())

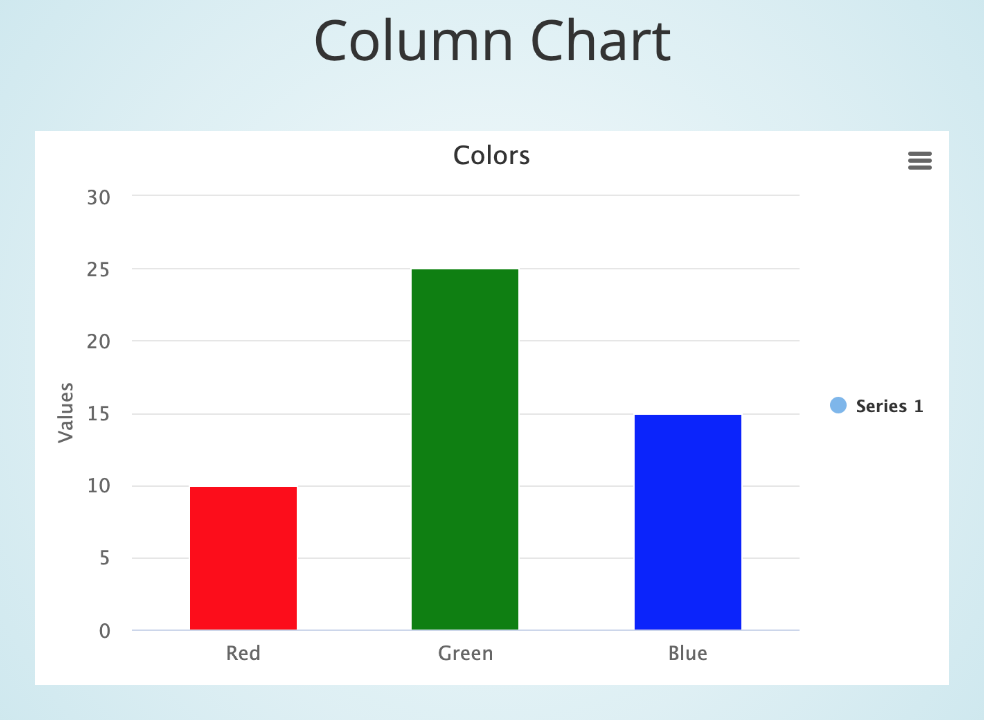
        self.create_column_chart(title="Colors")
        self.add_data_point("Red", 10, color="Red")
        self.add_data_point("Green", 25, color="Green")
        self.add_data_point("Blue", 15, color="Blue")
        self.add_slide("<p>Column Chart</p>" + self.extract_chart())

        self.create_line_chart(title="Last Week's Data")
        self.add_data_point("Sun", 5)
        self.add_data_point("Mon", 10)
        self.add_data_point("Tue", 20)
        self.add_data_point("Wed", 40)
        self.add_data_point("Thu", 80)
        self.add_data_point("Fri", 65)
        self.add_data_point("Sat", 50)
        self.add_slide("<p>Line Chart</p>" + self.extract_chart())

        self.begin_presentation(filename="chart_presentation.html")
Here's how to run that example:
cd examples/chart_maker
pytest chart_presentation.py
(Press the Right Arrow to advance to the next slide in that chart presentation)
(Click to see a live example of that presentation)
Multi-Series charts can also be created. Try the available examples to learn more.
self.create_pie_chart(
    chart_name=None, title=None, subtitle=None,
    data_name=None, unit=None, libs=True):
""" Creates a JavaScript pie chart using "HighCharts".
    @Params
    chart_name - If creating multiple charts,
                 use this to select which one.
    title - The title displayed for the chart.
    subtitle - The subtitle displayed for the chart.
    data_name - The series name. Useful for multi-series charts.
                If no data_name, will default to using "Series 1".
    unit - The description label given to the chart's y-axis values.
    libs - The option to include Chart libraries (JS and CSS files).
           Should be set to True (default) for the first time creating
           a chart on a web page. If creating multiple charts on the
           same web page, you won't need to re-import the libraries
           when creating additional charts.
    labels - If True, displays labels on the chart for data points.
    legend - If True, displays the data point legend on the chart.
"""self.create_bar_chart(
chart_name=None, title=None, subtitle=None,
data_name=None, unit=None, libs=True):
""" Creates a JavaScript bar chart using "HighCharts".
@Params
chart_name - If creating multiple charts,
use this to select which one.
title - The title displayed for the chart.
subtitle - The subtitle displayed for the chart.
data_name - The series name. Useful for multi-series charts.
If no data_name, will default to using "Series 1".
unit - The description label given to the chart's y-axis values.
libs - The option to include Chart libraries (JS and CSS files).
Should be set to True (default) for the first time creating
a chart on a web page. If creating multiple charts on the
same web page, you won't need to re-import the libraries
when creating additional charts.
labels - If True, displays labels on the chart for data points.
legend - If True, displays the data point legend on the chart.
"""self.create_column_chart(
chart_name=None, title=None, subtitle=None,
data_name=None, unit=None, libs=True):
""" Creates a JavaScript column chart using "HighCharts".
@Params
chart_name - If creating multiple charts,
use this to select which one.
title - The title displayed for the chart.
subtitle - The subtitle displayed for the chart.
data_name - The series name. Useful for multi-series charts.
If no data_name, will default to using "Series 1".
unit - The description label given to the chart's y-axis values.
libs - The option to include Chart libraries (JS and CSS files).
Should be set to True (default) for the first time creating
a chart on a web page. If creating multiple charts on the
same web page, you won't need to re-import the libraries
when creating additional charts.
labels - If True, displays labels on the chart for data points.
legend - If True, displays the data point legend on the chart.
"""self.create_line_chart(
chart_name=None, title=None, subtitle=None,
data_name=None, unit=None, zero=False, libs=True):
""" Creates a JavaScript line chart using "HighCharts".
@Params
chart_name - If creating multiple charts,
use this to select which one.
title - The title displayed for the chart.
subtitle - The subtitle displayed for the chart.
data_name - The series name. Useful for multi-series charts.
If no data_name, will default to using "Series 1".
unit - The description label given to the chart's y-axis values.
zero - If True, the y-axis always starts at 0. (Default: False).
libs - The option to include Chart libraries (JS and CSS files).
Should be set to True (default) for the first time creating
a chart on a web page. If creating multiple charts on the
same web page, you won't need to re-import the libraries
when creating additional charts.
labels - If True, displays labels on the chart for data points.
legend - If True, displays the data point legend on the chart.
"""self.create_area_chart(
chart_name=None, title=None, subtitle=None,
data_name=None, unit=None, zero=False, libs=True):
""" Creates a JavaScript area chart using "HighCharts".
@Params
chart_name - If creating multiple charts,
use this to select which one.
title - The title displayed for the chart.
subtitle - The subtitle displayed for the chart.
data_name - The series name. Useful for multi-series charts.
If no data_name, will default to using "Series 1".
unit - The description label given to the chart's y-axis values.
zero - If True, the y-axis always starts at 0. (Default: False).
libs - The option to include Chart libraries (JS and CSS files).
Should be set to True (default) for the first time creating
a chart on a web page. If creating multiple charts on the
same web page, you won't need to re-import the libraries
when creating additional charts.
labels - If True, displays labels on the chart for data points.
legend - If True, displays the data point legend on the chart.
"""If creating multiple charts at the same time, you can pass the chart_name parameter to distinguish between different charts.
self.add_data_point(label, value, color=None, chart_name=None):
""" Add a data point to a SeleniumBase-generated chart.
    @Params
    label - The label name for the data point.
    value - The numeric value of the data point.
    color - The HTML color of the data point.
            Can be an RGB color. Eg: "#55ACDC".
            Can also be a named color. Eg: "Teal".
    chart_name - If creating multiple charts,
                 use this to select which one.
"""self.add_series_to_chart(self, data_name=None, chart_name=None):
""" Add a new data series to an existing chart.
This allows charts to have multiple data sets.
@Params
data_name - Set the series name. Useful for multi-series charts.
chart_name - If creating multiple charts,
use this to select which one.
"""self.save_chart(chart_name=None, filename=None):
""" Saves a SeleniumBase-generated chart to a file for later use.
@Params
chart_name - If creating multiple charts at the same time,
use this to select the one you wish to use.
filename - The name of the HTML file that you wish to
save the chart to. (filename must end in ".html")
"""The full HTML of the chart is saved to the saved_charts/ folder.
self.extract_chart(chart_name=None):
""" Extracts the HTML from a SeleniumBase-generated chart.
    @Params
    chart_name - If creating multiple charts at the same time,
                 use this to select the one you wish to use.
"""self.display_chart(chart_name=None, filename=None):
""" Displays a SeleniumBase-generated chart in the browser window.
@Params
chart_name - If creating multiple charts at the same time,
use this to select the one you wish to use.
filename - The name of the HTML file that you wish to
save the chart to. (filename must end in ".html")
interval - The delay time for auto-advancing charts. (in seconds)
If set to 0 (default), auto-advancing is disabled.
"""All methods have the optional chart_name argument, which is only needed when storing multiple charts at the same time.

