CLI generation and plotting of random variables:
$ samplitude "sin(0.31415) | sample(6) | round | cli"
0.0
0.309
0.588
0.809
0.951
1.0
The word samplitude is a portmanteau of sample and amplitude. This project also started as an étude, hence should be pronounced sampl-étude.
samplitude is a chain starting with a generator, followed by zero or more
filters, followed by a consumer. Most generators are infinite (with the
exception of range and lists and possibly stdin). Some of the filters can
turn infinite generators into finite generators (like sample and gobble),
and some filters can turn finite generators into infinite generators, such as
choice.
Consumers are filters that necessarily flush the input; list, cli,
json, unique, and the plotting tools, hist, scatter and line are
examples of consumers. The list consumer is a Jinja2 built-in, and other
Jinja2 consumers are sum, min, and max:
samplitude "sin(0.31415) | sample(5) | round | max | cli"
0.951
For simplicity, s8e is an alias for samplitude.
In addition to the standard range function, we support infinite generators
exponential(lambd):lambdis 1.0 divided by the desired mean.uniform(a, b): Get a random number in the range[a, b)or[a, b]depending on rounding.gauss(mu, sigma):muis the mean, andsigmais the standard deviation.normal(mu, sigma): as abovelognormal(mu, sigma): as abovetriangular(low, high): Continuous distribution bounded by given lower and upper limits, and having a given mode value in-between.beta(alpha, beta): Conditions on the parameters arealpha > 0andbeta > 0. Returned values range between 0 and 1.gamma(alpha, beta): as aboveweibull(alpha, beta):alphais the scale parameter andbetais the shape parameter.pareto(alpha): Pareto distribution.alphais the shape parameter.vonmises(mu, kappa):muis the mean angle, expressed in radians between 0 and2*pi, andkappais the concentration parameter, which must be greater than or equal to zero. If kappa is equal to zero, this distribution reduces to a uniform random angle over the range 0 to2*pi.
Provided that you have installed the scipy.stats package, the
pert(low, peak, high)distribution is supported.
We have a special infinite generator (filter) that works on finite generators:
choice,
whose behaviour is explained below.
For input from files, either use words with a specified environment variable
DICTIONARY, or pipe through
stdin()
which reads from stdin.
If the file is a csv file, there is a csv generator that reads a csv file with
Pandas and outputs the first column (if nothing else is specified). Specify the
column with either an integer index or a column name:
>>> samplitude "csv('iris.csv', 'virginica') | counter | cli"
0 50
1 50
2 50
For other files, we have the file generator:
>>> s8e "file('iris.csv') | sample(1) | cli"
150,4,setosa,versicolor,virginica
Finally, we have combinations and permutations that are inherited from
itertools and behave exactly like those.
>>> s8e "'ABC' | permutations | cli"However, the output of this is rather non-UNIXy, with the abstractions leaking through:
>>> s8e "'HT' | permutations | cli"
('H', 'T')
('T', 'H')
So to get a better output, we can use an elementwise join elt_join:
>>> s8e "'HT' | permutations | elt_join | cli"
H T
T H
which also takes a seperator as argument:
>>> s8e "'HT' | permutations | elt_join(';') | cli"
H;T
T;H
This is already supported by Jinja's map function (notice the strings around join):
>>> s8e "'HT' | permutations | map('join', ';') | cli"
H;T
T;H
We can thus count the number of permutations of a set of size 10:
>>> s8e "range(10) | permutations | len"
3628800
The product generator takes two generators and computes a cross-product of
these. In addition,
All generators are (potentially) infinite generators, and must be sampled with
sample(n) before consuming!
Install with
pip install samplitudeor to get bleeding release,
pip install git+https://github.com/pgdr/samplitudeThis is pure Jinja2:
>>> samplitude "range(5) | list"
[0, 1, 2, 3, 4]
However, to get a more UNIXy output, we use cli instead of list:
>>> s8e "range(5) | cli"
0
1
2
3
4
To limit the output, we use sample(n):
>>> s8e "range(1000) | sample(5) | cli"
0
1
2
3
4
That isn't very helpful on the range generator, which is already finite, but
is much more helpful on an infinite generator. The above example is probably
better written as
>>> s8e "count() | sample(5) | cli"
0
1
2
3
4
However, much more interesting are the infinite random generators, such as the
uniform generator:
>>> s8e "uniform(0, 5) | sample(5) | cli"
3.3900198868059235
1.2002767137709318
0.40999391897569126
1.9394585953696264
4.37327472704115
We can round the output in case we don't need as many digits (note that round
is a generator as well and can be placed on either side of sample):
>>> s8e "uniform(0, 5) | round(2) | sample(5) | cli"
4.98
4.42
2.05
2.29
3.34The sample behavior is equivalent to the head program, or from languages
such as Haskell. The head alias is supported:
>>> samplitude "uniform(0, 5) | round(2) | head(5) | cli"
4.58
4.33
1.87
2.09
4.8
drop is also available:
>>> s8e "uniform(0, 5) | round(2) | drop(2) | head(3) | cli"
1.87
2.09
4.8
To shift and scale distributions, we can use the shift(s) and
scale(s) filters.
To get a Poisson distribution process starting at 15, we can run
>>> s8e "poisson(4) | shift(15) | sample(5) |cli"
18
21
19
22
17
or to get the Poisson point process (exponential distribution),
>>> s8e "exponential(4) | round | shift(15) | sample(5) |cli"
16.405
15.54
15.132
15.153
15.275
Both shift and scale work on generators, so to add sin(0.1) and
sin(0.2), we can run
>>> s8e "sin(0.1) | shift(sin(0.2)) | sample(10) | cli"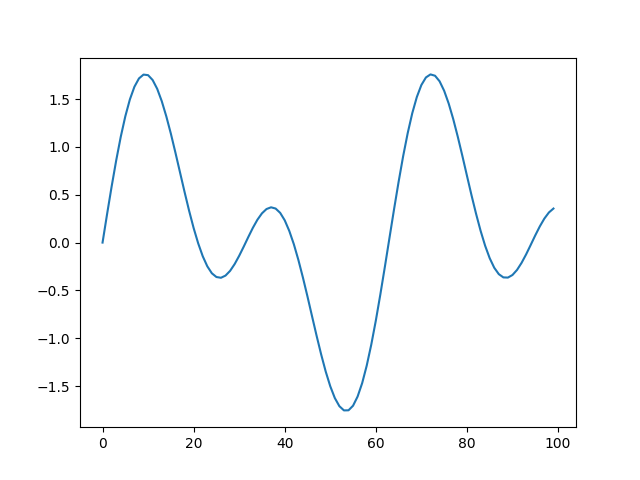
Using choice with a finite generator gives an infinite generator that chooses
from the provided generator:
>>> samplitude "range(0, 11, 2) | choice | sample(6) | cli"
8
0
8
10
4
6
Jinja2 supports more generic lists, e.g., lists of strings. Hence, we can write
>>> s8e "['win', 'draw', 'loss'] | choice | sample(6) | sort | cli"
draw
draw
loss
loss
loss
win
... and as in Python, strings are also iterable:
>>> s8e "'HT' | cli"
H
T
... so we can flip six coins with
>>> s8e "'HT' | choice | sample(6) | cli"
H
T
T
H
H
H
We can flip 100 coins and count the output with counter (which is
collections.Counter)
>>> s8e "'HT' | choice | sample(100) | counter | cli"
H 47
T 53
The sort functionality works as expected on a Counter object (a
dict type), so if we want the output sorted by key, we can run
>>> s8e "range(1,7) | choice | sample(100) | counter | sort | elt_join | cli" 42 # seed=42
1 17
2 21
3 12
4 21
5 13
6 16
There is a minor hack to sort by value, namely by swap-ing the Counter twice:
>>> s8e "range(1,7) | choice | sample(100) |
         counter | swap | sort | swap | elt_join | cli" 42 # seed=42
3 12
5 13
6 16
1 17
2 21
4 21
The swap filter does an element-wise reverse, with element-wise reverse
defined on a dictionary as a list of (value, key) for each key-value pair in
the dictionary.
So, to get the three most common anagram strings, we can run
>>> s8e "words() | map('sort') | counter | swap | sort(reverse=True) |
         swap | sample(3) | map('first') | elt_join('') | cli"
aeprs
acerst
opst
Using stdin() as a generator, we can pipe into samplitude. Beware that
stdin() flushes the input, hence stdin (currently) does not work with
infinite input streams.
>>> ls | samplitude "stdin() | choice | sample(1) | cli"
some_file
Then, if we ever wanted to shuffle ls we can run
>>> ls | samplitude "stdin() | shuffle | cli"
some_file
>>> cat FILE | samplitude "stdin() | cli"
# NOOP; cats FILEFor fun, if you have installed matplotlib, we support plotting, hist being
the most useful.
>>> samplitude "normal(100, 5) | sample(1000) | hist"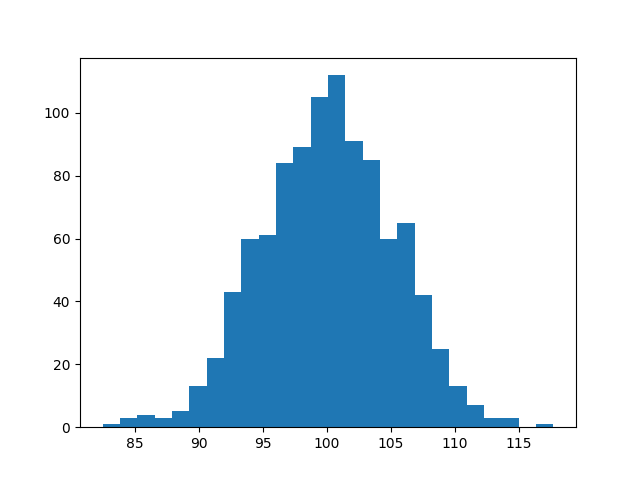
An exponential distribution can be plotted with exponential(lamba). Note that
the cli output must be the last filter in the chain, as that is a command-line
utility only:
>>> s8e "normal(100, 5) | sample(1000) | hist | cli"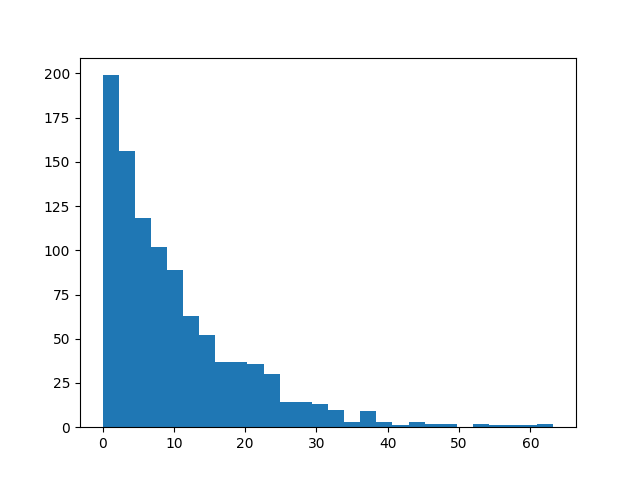
To repress output after plotting, you can use the gobble filter to empty
the pipe:
>>> s8e "normal(100, 5) | sample(1000) | hist | gobble"The
pert distribution
takes inputs low, peak, and high:
>>> s8e "pert(10, 50, 90) | sample(100000) | hist(100) | gobble"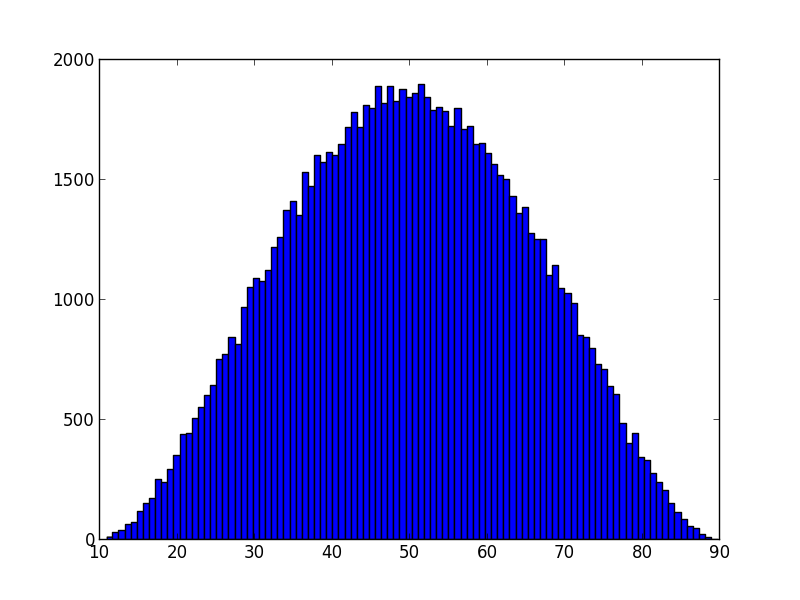
Although hist is the most useful, one could imaging running s8e on
timeseries, where a line plot makes most sense:
>>> s8e "sin(22/700) | sample(200) | line"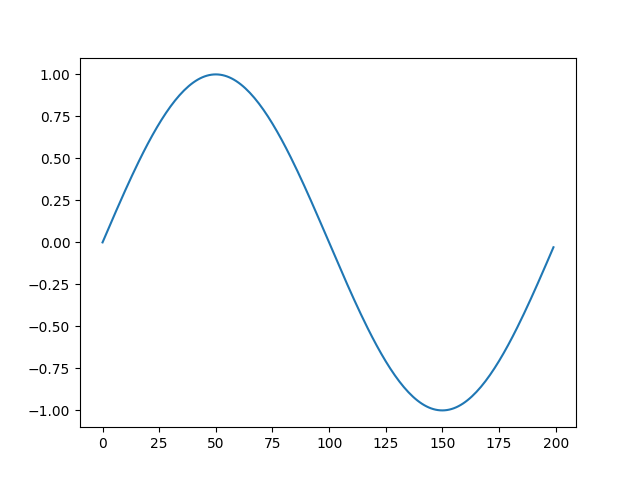
The scatter function can also be used, but requires that the input stream is a
stream of pairs, which can be obtained either by the product generator, or via
the pair or counter filter:
s8e "normal(100, 10) | sample(10**5) | round(0) | counter | scatter"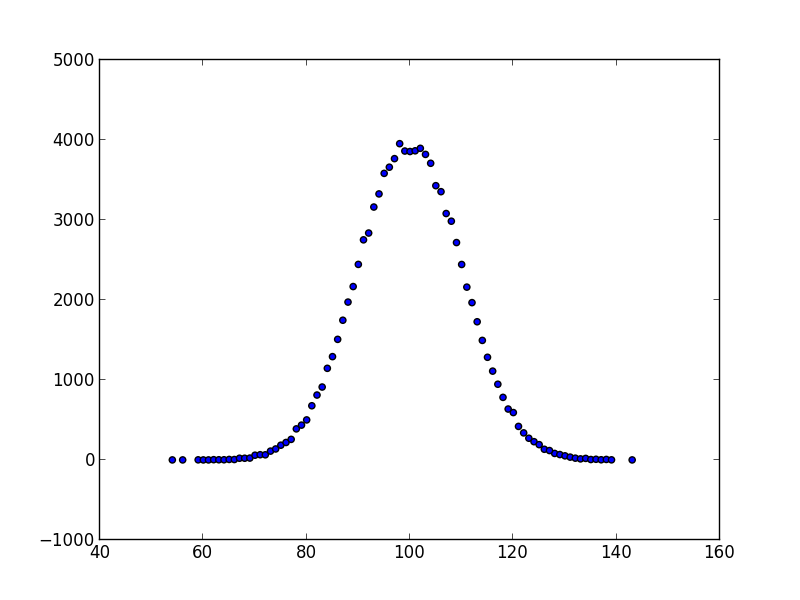
A fourier transform is offered as a filter fft:
>>> samplitude "sin(0.1) | shift(sin(0.2)) | sample(1000) | fft | line | gobble"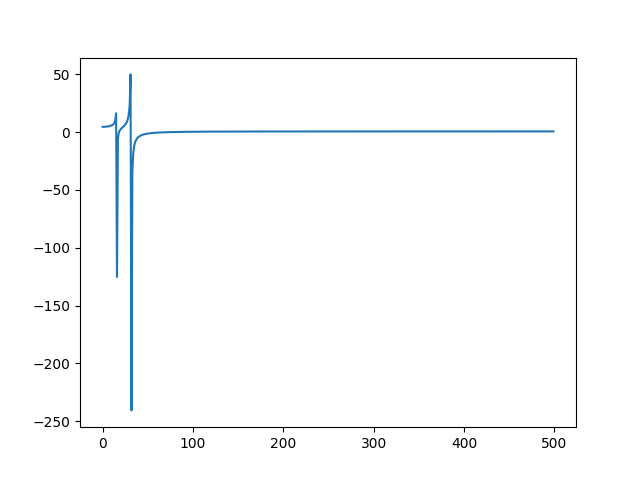
If you use Samplitude programmatically, you can register your own filter by sending a dictionary
{'name1' : filter1,
 'name2' : filter2,
 #...,
 'namen' : filtern,
}
to the samplitude function.
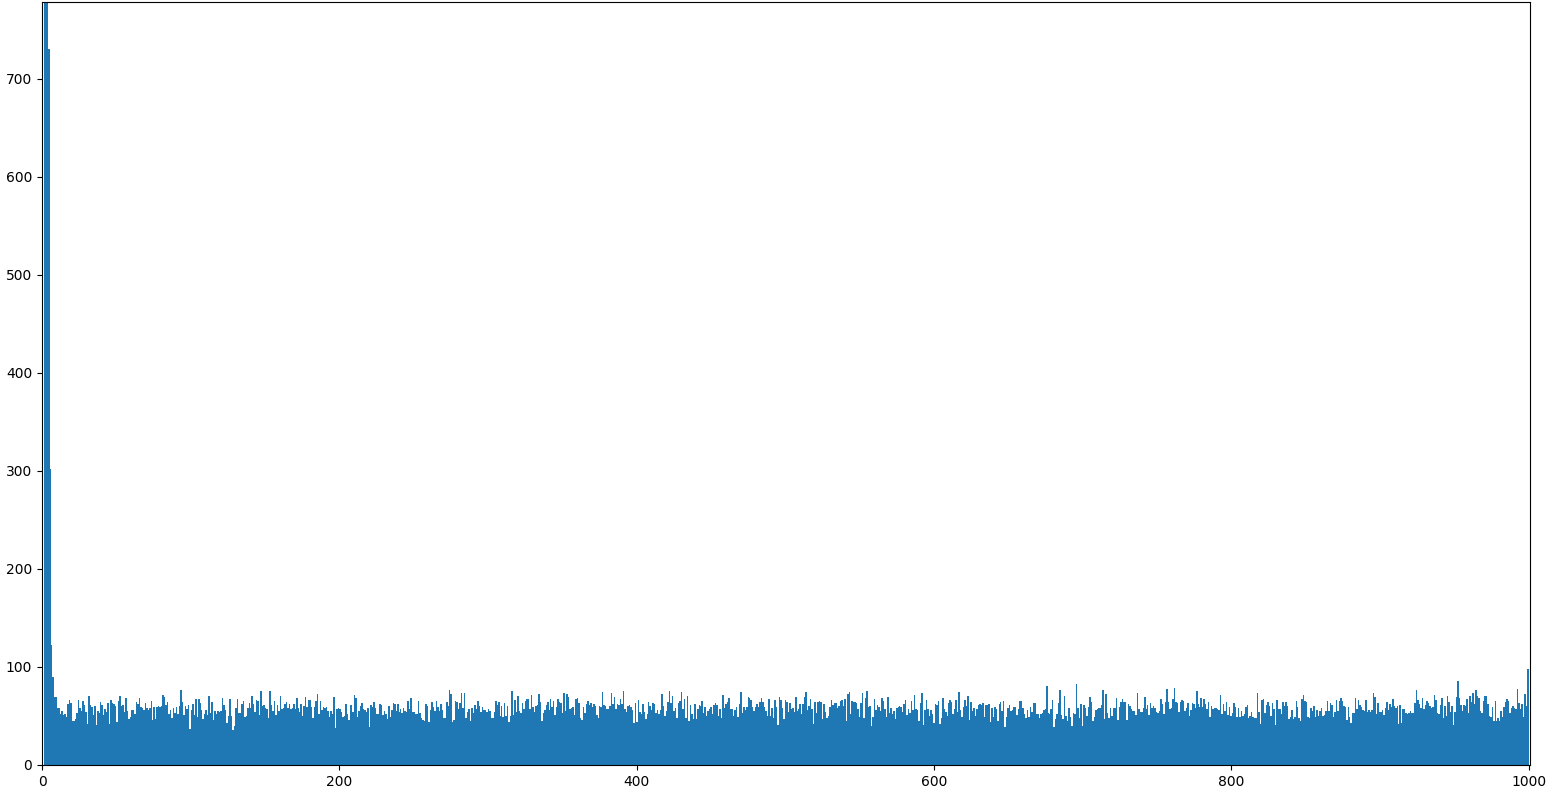
Suppose you want to emulate the secretary problem ...
For those not familiar, you are a boss, Alice, who wants to hire a new secretary Bob. Suppose you want to hire the tallest Bob of all your candidates, but the candidates arrive in a stream, and you know only the number of candidates. For each candidate, you have to accept (hire) or reject the candidate. Once you have rejected a candidate, you cannot undo the decision.
The solution to this problem is to look at the first n/e (e~2.71828 being
the Euler constant) candidates, and thereafter accept the first candidate taller
than all of the n/e first candidates.
Let normal(170, 10) be the candidate generator, and let n=100. We create a
filter secretary that takes a stream and an integer (n) and picks according
to the solution. In order to be able to assess the quality of the solution
later, the filter must forward the entire list of candidates; hence we annotate
the one we choose with (c, False) for a candidate we rejected, and (c, True)
denotes the candidate we accepted.
def secretary(gen, n):
    import math
    explore = int(n / math.e)
    target = -float('inf')
    i = 0

    # explore the first n/e candidates
    for c in gen:
        target = max(c, target)
        yield (c, False)
        i += 1
        if i == explore:
            break

    _ok = lambda c, i, found: ((i == n-1 and not found)
                            or (c > target and not found))

    have_hired = False
    for c in gen:
        status = _ok(c, i, have_hired)
        have_hired = have_hired or status
        yield c, status
        i += 1
        if i == n:
            return
Now, to emulate the secretary problem with Samplitude:
from samplitude import samplitude as s8e

# insert above secretary function

n = 100
filters = {'secretary': secretary}

solution = s8e('normal(170, 10) | secretary(%d) | list' % n, filters=filters)
solution = eval(solution)  # Samplitude returns an eval-able string
cands = map(lambda x: x[0], solution)
opt = [s[0] for s in solution if s[1]][0]
# the next line prints in which position the candidate is
print(1+sorted(cands, reverse=True).index(opt), '/', n)
In about 67% of the cases we can expect to get one of the top candidates, whereas the remaining 33% of the cases will be uniformly distributed. Running 100k runs with a population of size 1000 reveals the structure.