Installation
Note: This has only been tested with Grafana 2.5.0 and 2.6.0-beta1. I cannot guarantee it will work with older versions.
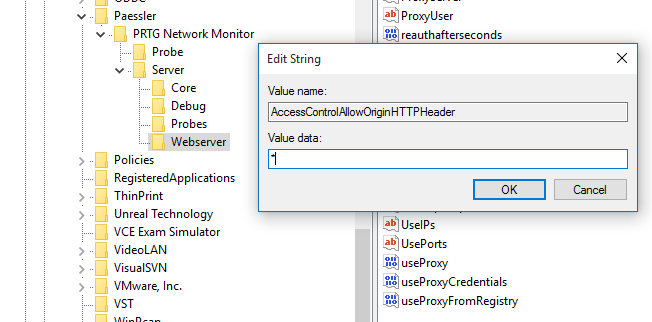
You will need to configure PRTG to add an Access-Control-Allow-Origin HTTP header. This can be done in two simple steps:
Step -1: Add a String value named "AccessControlAllowOriginHTTPHeader" to the registry key HKLM\Software\Wow6432Node\Paessler\PRTG Network Monitor\Server\Webserver.
Step 1: Download the current release from the master branch.
Step 2: Copy/move the PRTG directory into your Grafana public/app/plugins/datasource directory.
Step 3: Restart the Grafana server.
Step 4: Select the Datasource page and click the "Add new" button.
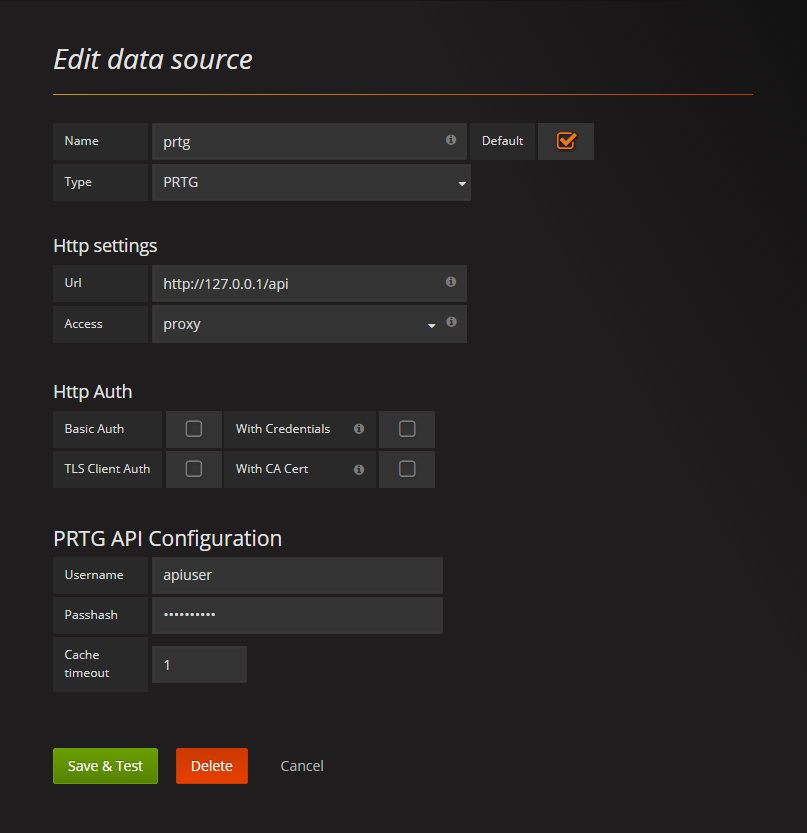
Step 5: Provide information - choose a simple name, e.g., "PRTG" and provide the API URL and credentials.
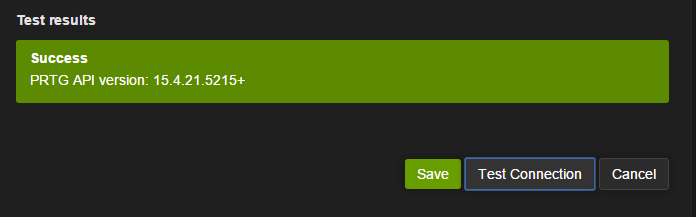
Step 6: Click the "Test Connection" button to verify your datasource connection.
Step 7: Go make dashboards!