This extension can create a number of graphical visualizations for you. All of them (except of the railroad/syntax diagram) share the same look and feel (they are all based on D3.js). You can press and hold the left mouse button in a free area in the graph and drag the mouse, to move the graph's view port. The mouse wheel or track pad can be used to zoom in and out. Certain graphs allow for additional actions, see below.
All graphs also allow to export them to an SVG file (and in the case of the full RRD list, also to an HTML file). The export will add the internal CSS file, as well as all custom CSS files you have specified for a graph type (in the settings) to the exported SVG. SVG files always use the light theme style colors, while the HTML output follows the currently set vscode theme.
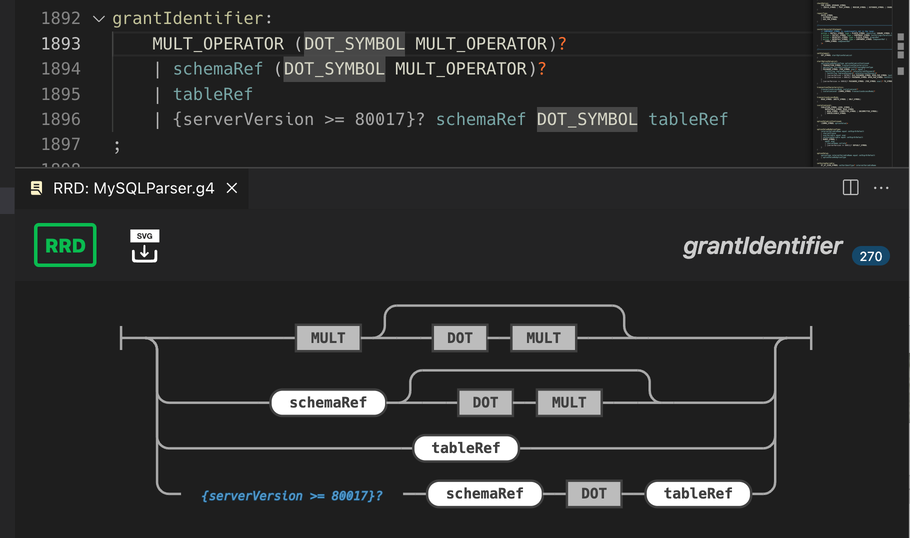
Available from the editor context menu is a function to generate railroad diagrams for all types of rules (parser, lexer, fragment lexer), provided by the railroad-diagrams script from Tab Atkins Jr.. You can either do that for the rule under the caret (and the display changes as you move the caret) or for the entire grammar file. An export function allows to generate an SVG file of the graph on disk. Colors + fonts can be adjusted by using custom CSS file(s). See also the available options.
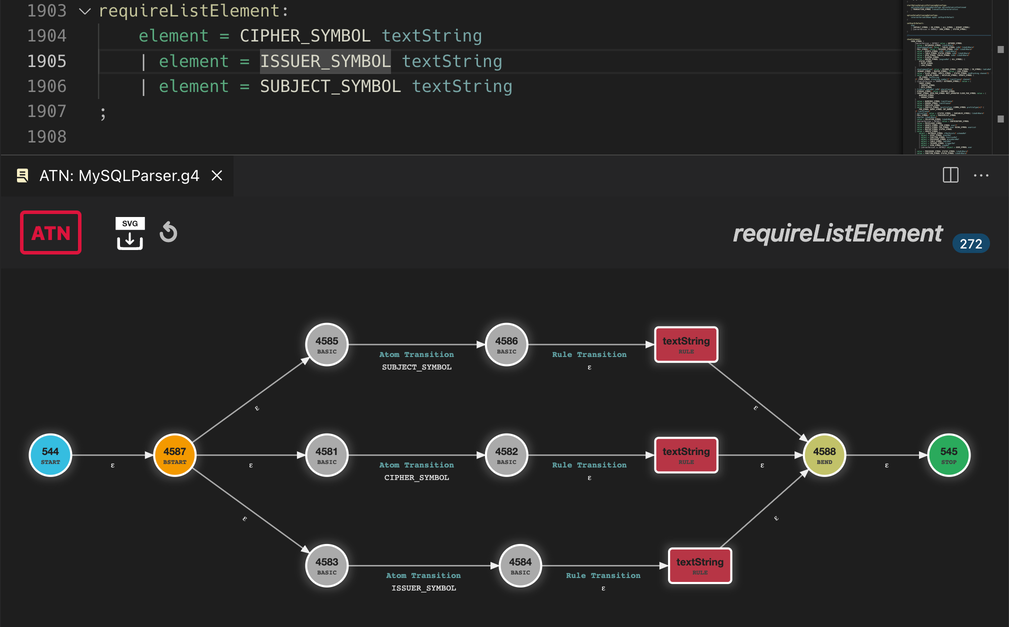
Also available from the editor context menu are the ATN graphs. They are a visualization of the internal ATN (Augmented Transition Network) that drives lexers + parsers. This graph uses a dynamic layout to find good positions for the nodes without overlapping. However, this is rarely satisfying. Therefore you can move nodes around to make the graph prettier. Moved nodes stick to their positions, even if you close and reopen the graph. Double click a node to make it float again or click Reset display to remove all cached positions.
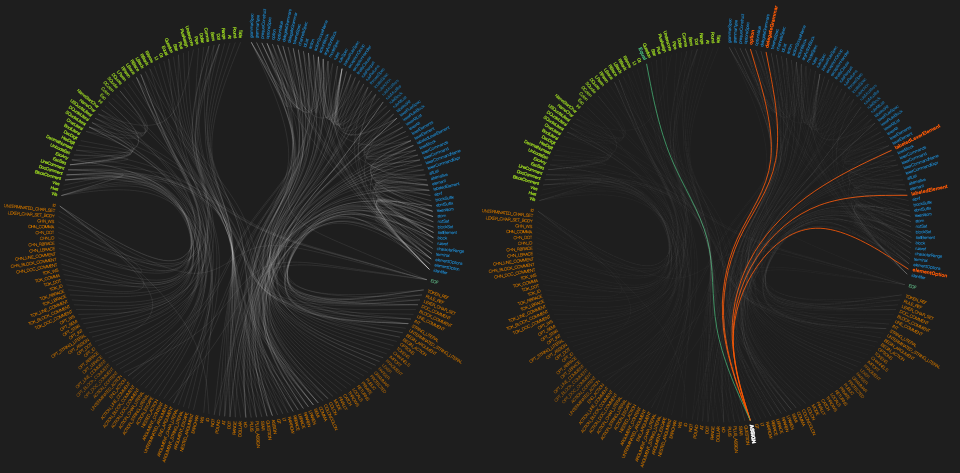
In order to get an impression about the complexity of your grammar and visually find rule relationships there's a call graph (a dendrogram), also available from the editor context menu. It draws connections between rules (parser, lexer + fragment rules), for the current grammar as well as those used by it. Endpoints are grouped by file and each file gets an own color. There's an own section for built-in tokens (currently only EOF).
The more lines you see, the higher the rules interact with each other. You can hover with the mouse over a rule name and it will highlight all relationships for that rule (while the rest is faded out). Red lines are drawn to callers of that rule, green lines for those called by it. Hence many red lines means this is a rule used by many others and hence a good candidate for optimization. Many green lines however indicate a high complexity and you should perhaps refactor this rule into multiple smaller ones.


