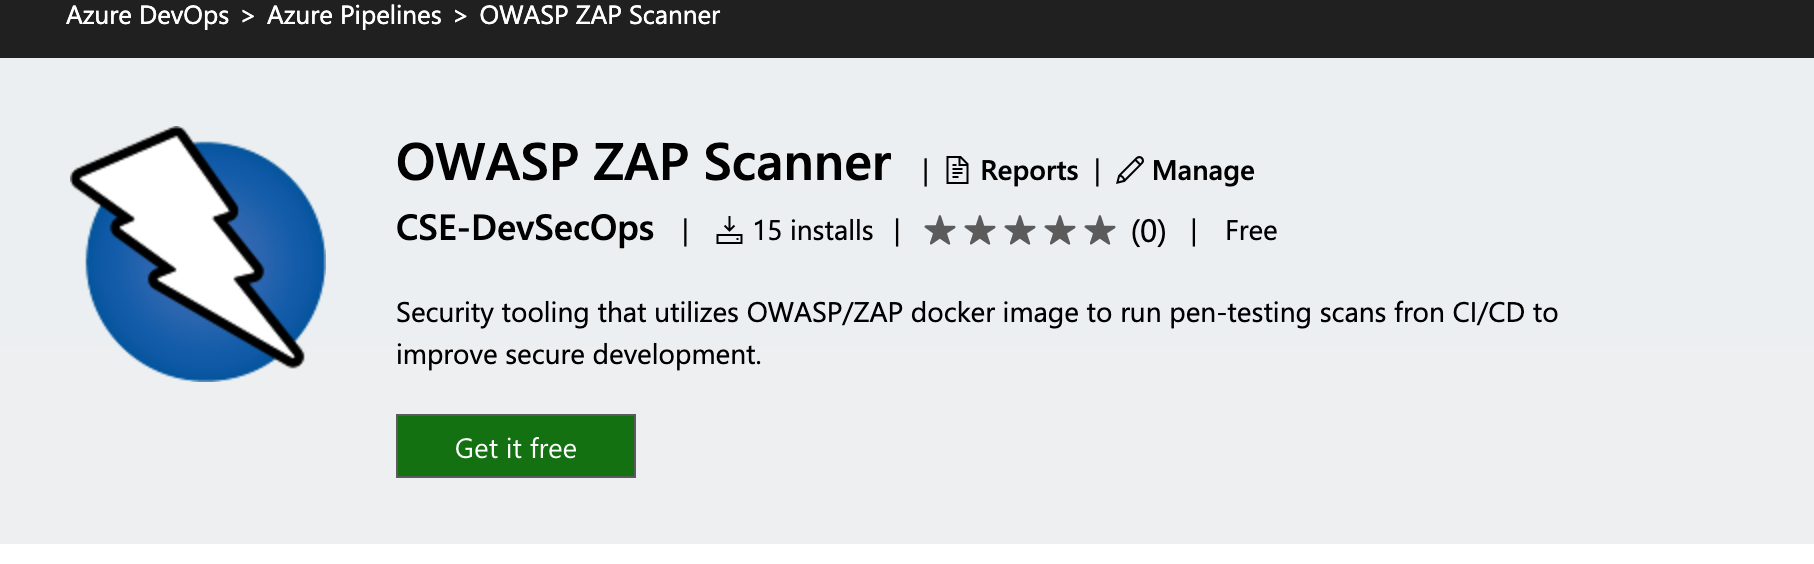
OWASP/ZAP is a popular free security tool for helping to identify vulnerabilities during the development process from OWASP. This extension shifts scanning and reporting into the Azure DevOps Pipeline model to enable quick feedback and response from development teams throughout the development life-cycle.
This task simplifies shifting security scanning of web applications into the DevOps pipeline in part by removing the requirement of having a running, exposed ZAP proxy before attempting the scan. By installing the proxy, you are enabling self-contained scans within your CI/CD pipeline. The core requirement for usage is a Docker install available to this task which supports running Linux containers. The operating system of the host is otherwise irrelevant. When this requirement is not met, the task will fail with an error message of image operating system "linux" cannot be used on this platform.
After installing the scanner from the Azure DevOps Marketplace, you will need to add the scanner to your agent job and configure a few basic requirements.
-
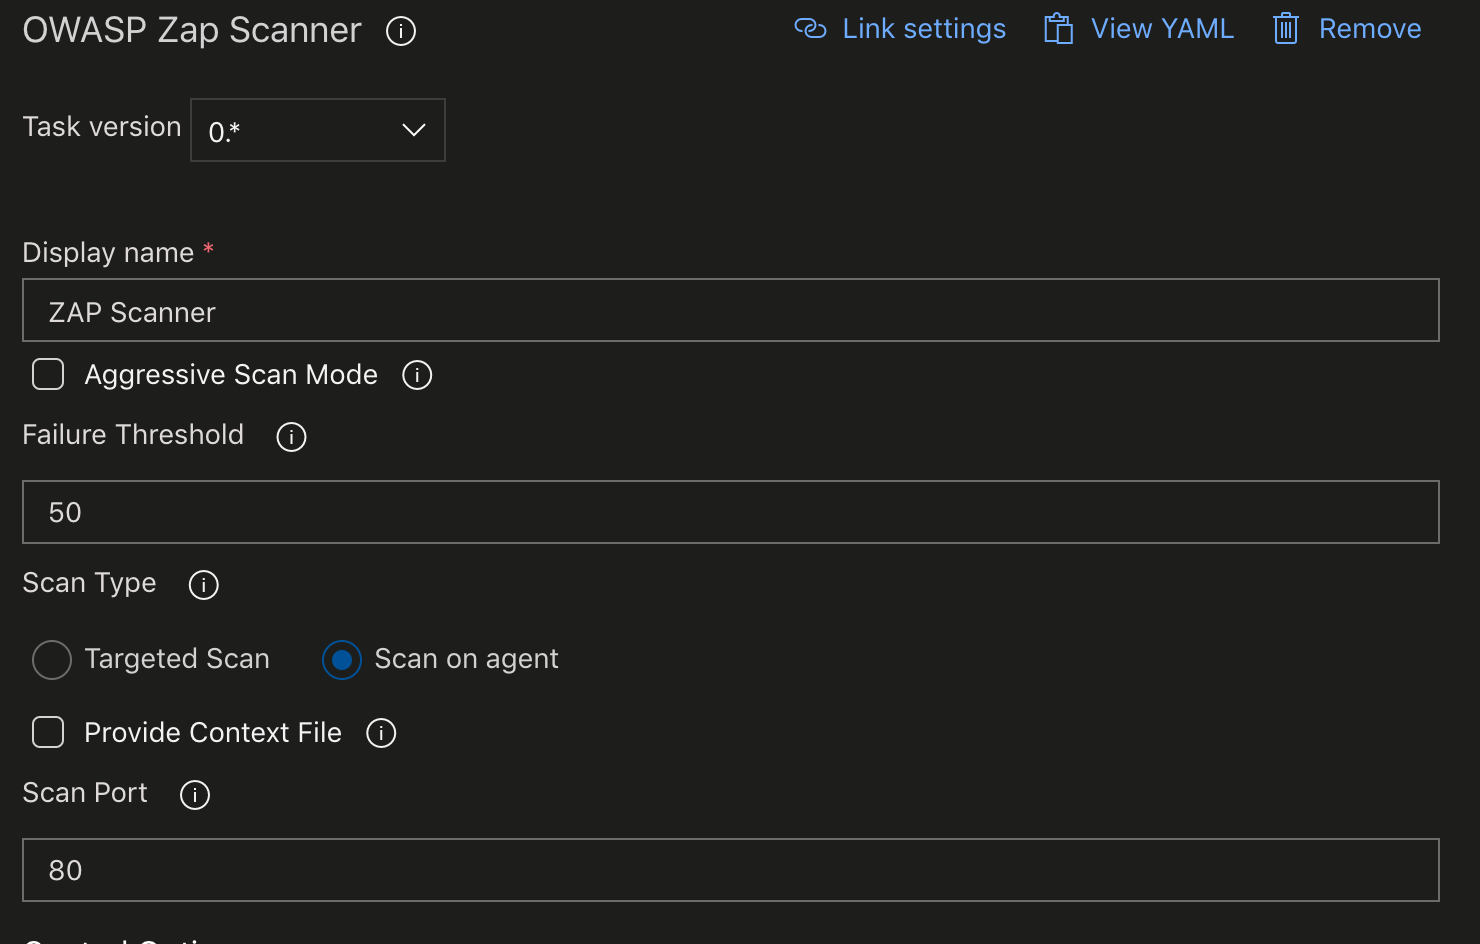
The "Display name" of the task can be left as-is, or it can be updated to fit withing the naming conventions of your pipeline better.
-
By default, the task will run a baseline scan.
-
Custom configuration for ZAP may be provided through a "context file". This is ZAP functionality, and is documented by the official project team.
The baseline scan will spider the target for 1 minute and then wait for the passive scanning to complete. This makes for a relatively short-running scan that doesn't perform any attacks.
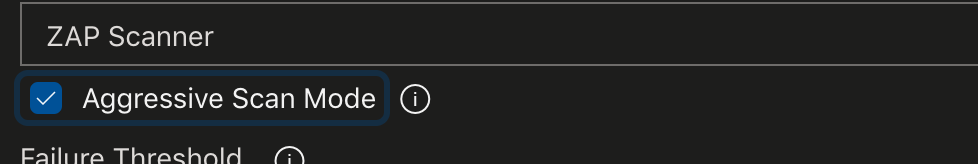
A full-scan can be run by ticking the "Aggressive Scan Mode" checkbox. This scan doesn't have a time limit and does perform 'attacks.' It can run for a long time. Not ideally suited for CI, but is a useful tool for release-gates.
-
The "Failure Threshold" indicates the score at which the pipeline will begin to fail. The scoring mechanism built into this scanner is meant to be suggestive, and security personnel knowledgable about threat-models for the specific application should be engaged to adjust this value appropriately. The default of 50 is only a starting point for incorporating the scanner and is not likely to be what works for your application! The ZAP scanner generates an HTML report (available in the Az DevOps build artifacts) that contains one entry per vulnerability discovered along with a confidence rating without any grouping. This approach does not provide a useful story from a developer perspective. The threshold sets out to provide a handy reference for improving the development workflow when considering vulnerability scanning. This limit is an aggregate score that first groups like vulnerabilities before applying the confidences, and total times a type of vulnerability appears to score the scan.
-
By default, that "Scan Type" used is "Scan on Agent." This type of scan is beneficial in pipelines for containerized applications. This usage requires a preceding step to build your image and run it (detached) within the agent.
-
When running a full-scan in release-pipelines, or if your application is not containerized and has to run in a VM, "Scan Type" can be changed to "Targeted Scan." In this case, you are required to provide the schema and address for your target. Ex. https://10.20.10.40 or http://myWebSite.net.
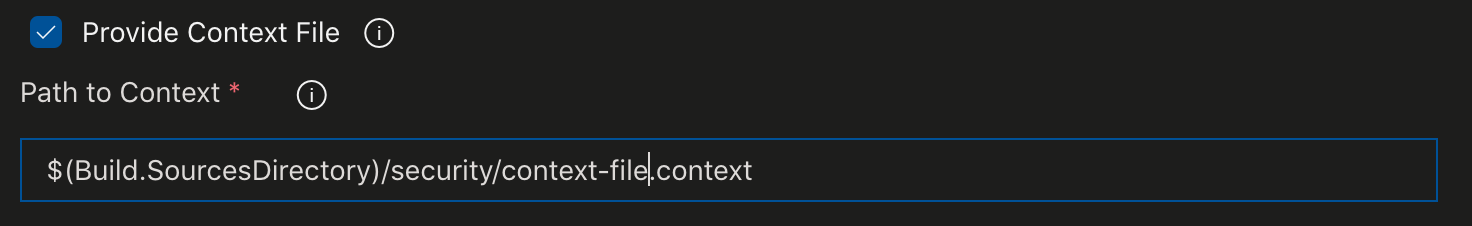
- By default, the scan will be performed without much effort at scoping for tech, excluded URL endpoints, etc.., but you can provide a context file for a more focused scan. The context file is useful to take full advantage of the baseline scans minute of crawling or, to narrow the scope of a full-scan in aggressive mode to keep the duration as short as possible. To accomplish this, check the "Provide Context File" box and provide the path to a context file in your source repository relative to the build copy of the source.
-
ZAP contexts and context files are not within the scope of our documentation. Please refer to ZAP's official documentation, here.
-
Finally, provide an optional port number for custom ports. By default, the scan will be interested in port 80 on the target system.
The extension generates 2 reports (report.html & report.json) that both contain the details of the results. These reports are in a directory "owaspzap" once the scanner completes. To be useful the report can be staged and published. For example the following tasks will attach these raw output files as build artifacts.
The ZAP scanner includes several reporting options. None of which are optimal for use by development teams. However, we do provide several of these (HTML & JSON) as downloadable artifacts in the build. To make the scans more useful for development teams and get real feedback into the pipeline, we want a more helpful report of the scan results. Above, we discussed generating a threshold for scoring and failing a CI build. Below are some path(s) to reporting. The goal here is providing a flexible extension that can be reported on as appropriate for your project/team with some possible paths on getting even more value from the extensions.
If you would like to publish the generated html & json reports as build artifacts you can use the copy and publish tasks available in Azure Devops!
- task: CopyFiles@2
  condition: always()
  inputs:
    SourceFolder: 'owaspzap/'
    TargetFolder: '$(Build.ArtifactStagingDirectory)'

- task: PublishBuildArtifacts@1
  condition: always()
  inputs:
ArtifactName: 'owasp_zap_reports'Additionally, you can take advantage of handlebars templating for a simple reporting dashboard/tab and generate the template to report from.
- bash: |
   sudo npm install -g handlebars-cmd

   cat <<EOF > owaspzap/nunit-template.hbs

   <test-run
       id="2"
       name="Owasp test"
       start-time="{{@generated}}">
       {{#each site}}<test-suite
           id="{{@index}}"
           type="Assembly"
           name="{{[@name]}}"
           result="Failed"
           failed="{{alerts.length}}">
           <attachments>
               <attachment>
                   <filePath>$BUILD_SOURCESDIRECTORY/owaspzap/report.html</filePath>
               </attachment>
           </attachments>
           {{#each alerts}}<test-case
               id="{{@index}}"
               name="{{alert}}"
               result="Failed"
               fullname="{{alert}}"
               time="1">
               <failure>
                   <message>
                       <![CDATA[{{{desc}}}]]>
                   </message>
                   <stack-trace>
                       <![CDATA[
   Solution:
   {{{solution}}}

   Reference:
   {{{reference}}}

   instances:{{#each instances}}
   * {{uri}}
       - {{method}}
       {{#if evidence}}- {{{evidence}}}{{/if}}
                       {{/each}}]]>
                   </stack-trace>
               </failure>
           </test-case>
           {{/each}}
       </test-suite>
       {{/each}}
   </test-run>
   EOF
  displayName: 'owasp nunit template'
condition: always()Use the handlebars template and json report from the ZAP scan to generate an xml report in the nunit style to display.
- bash: ' handlebars owaspzap/report.json < owaspzap/nunit-template.hbs > owaspzap/test-results.xml'
  displayName: 'generate nunit type file'
condition: always()- task: PublishTestResults@2
displayName: 'Publish Test Results **/TEST-*.xml'
inputs:
testResultsFormat: NUnit
testResultsFiles: 'owaspzap/test-results.xml'
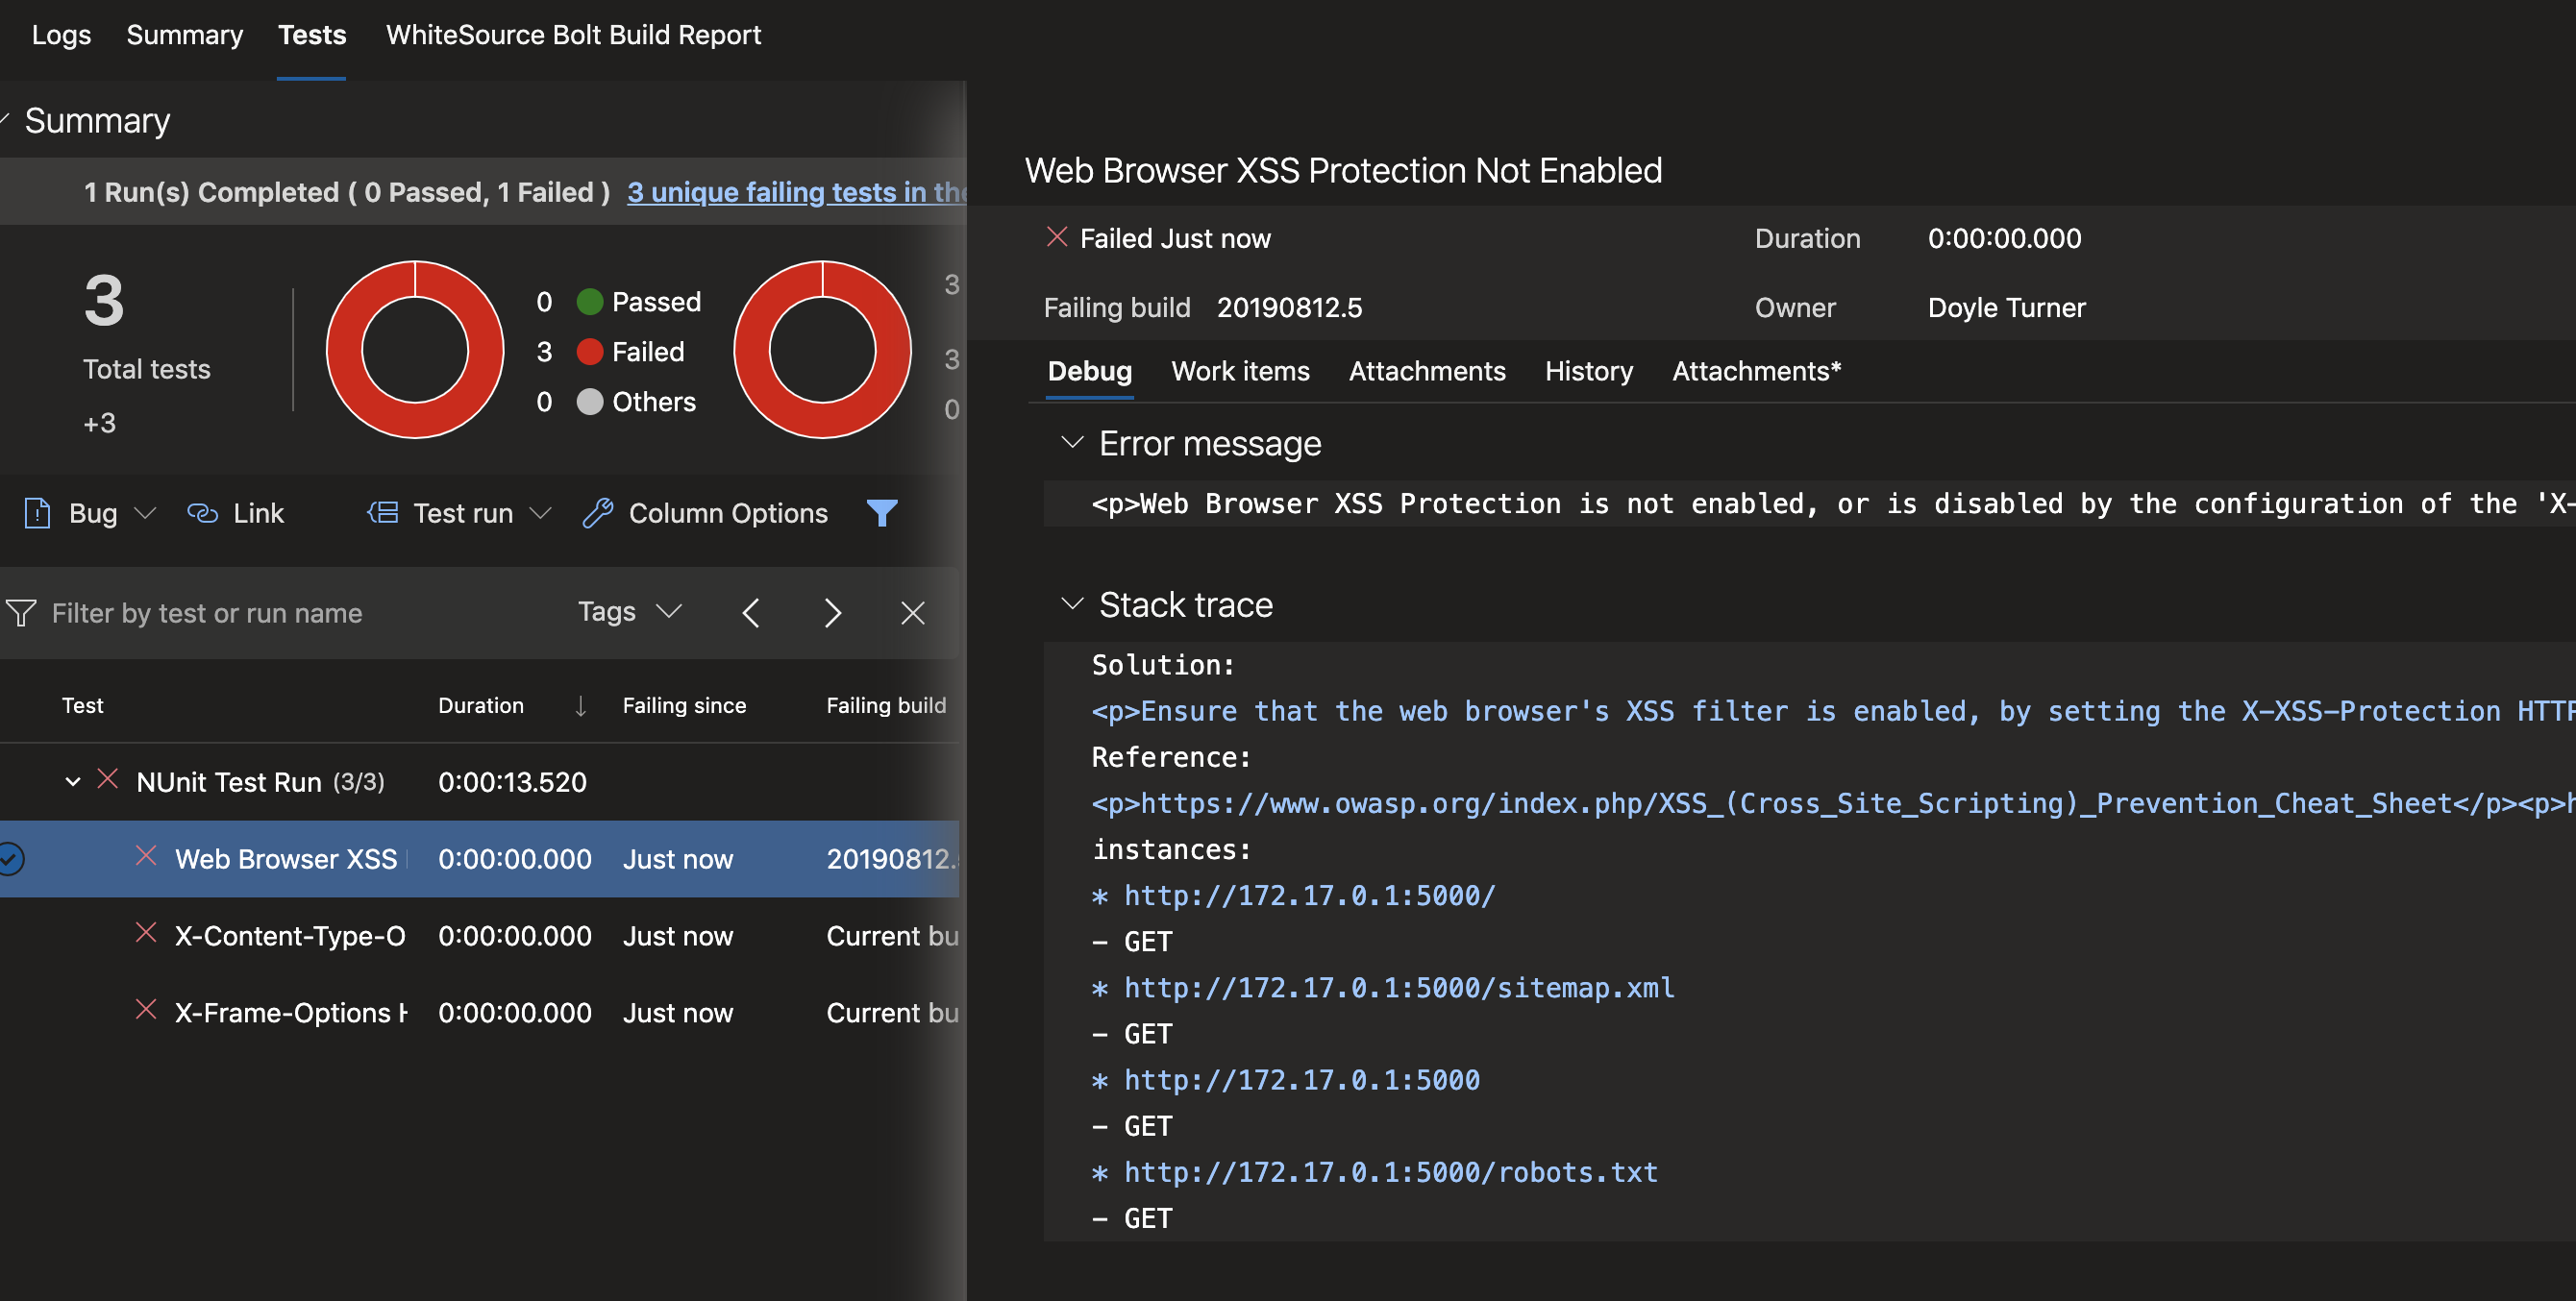
condition: always()You should now have 'test' tab on the pipeline build that displays useful infomration about vulnerabilities revealed during the scan. The vulnerability test results are not reliant on the pass/fail outcome of the build. This means that even with a scan that is acceptable by the threshold you could have some areas of concern to explore in the repot.
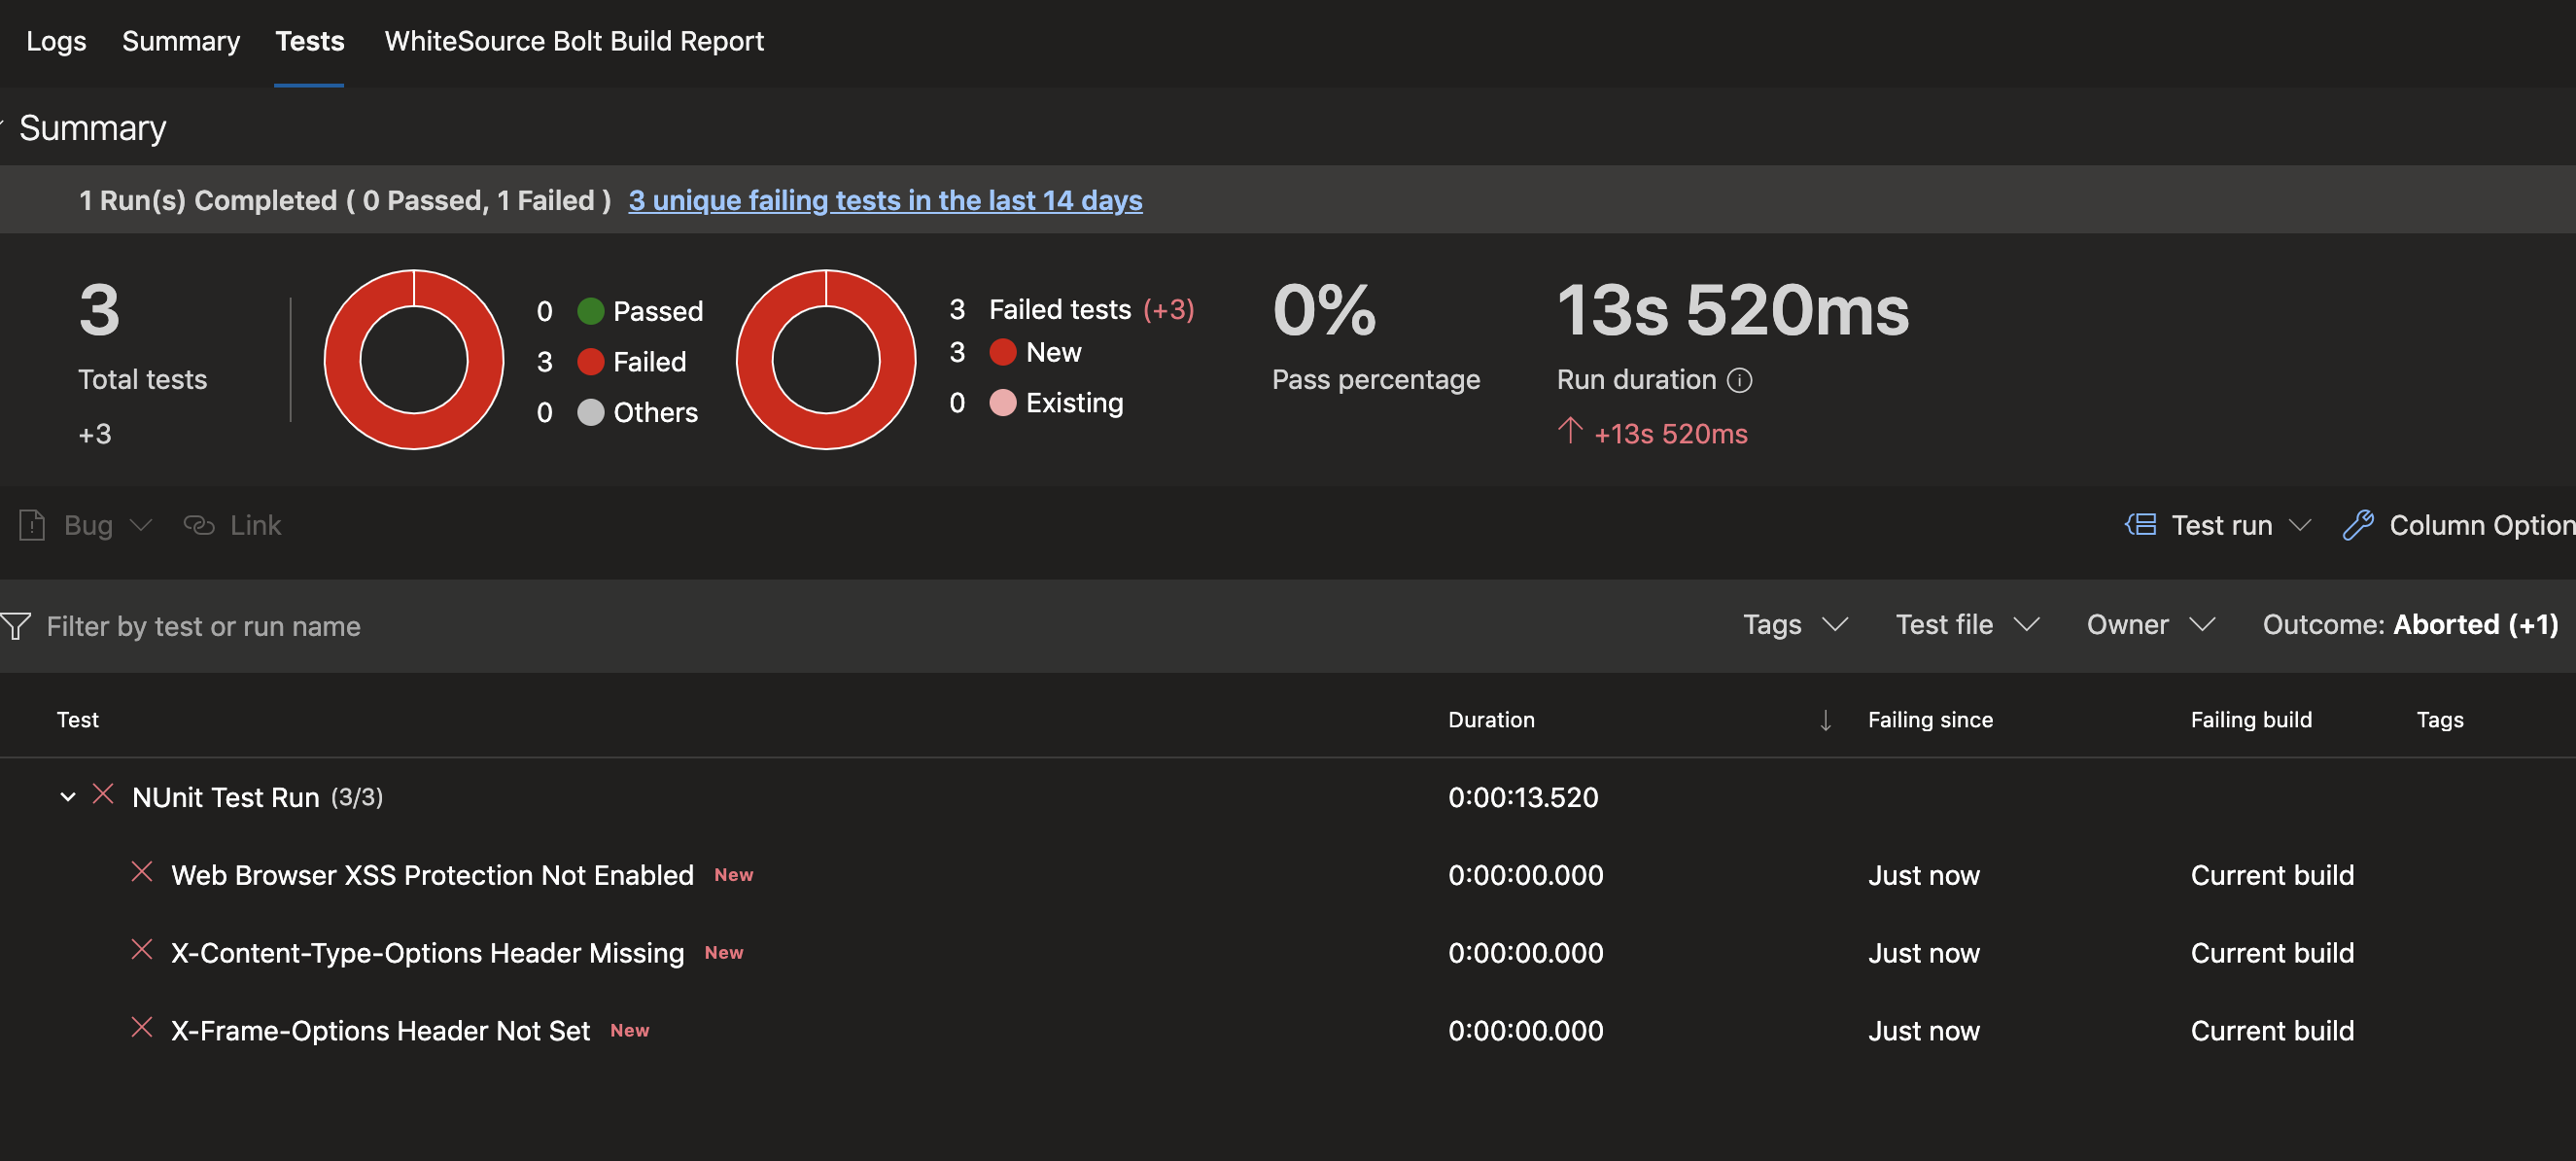
The list of failures (currently under "NUnit Test Run) are expandable links. Clicking on each will open details to the right which can guide the team to fixing the issues found.
Other reporting options will be added to the extension. The HTML & JSON report will remain and offer the flexibility for parsing and publishing customer reports as above using the approach that works best for your team and project.