Pigeon-http comes with a Datadog custom metric integration to gather metrics during HTTP calls. It is enabled by default, but you need to set some credentials to make it work.
By default, Pigeon-http needs to access these environment variables.
STATSD_HOST=
STATSD_PORT=
DD_ENV=
DD_SERVICE=
TO DO: Make it configurable.
When initializing Pigeon-http, you need to specify the request name.
p = Pigeon::Client.new('http_integration')
'http_integration' will become a custom metric namespace.
By default, Pigeon-http will collect these metrics:
- Latency
- Througput
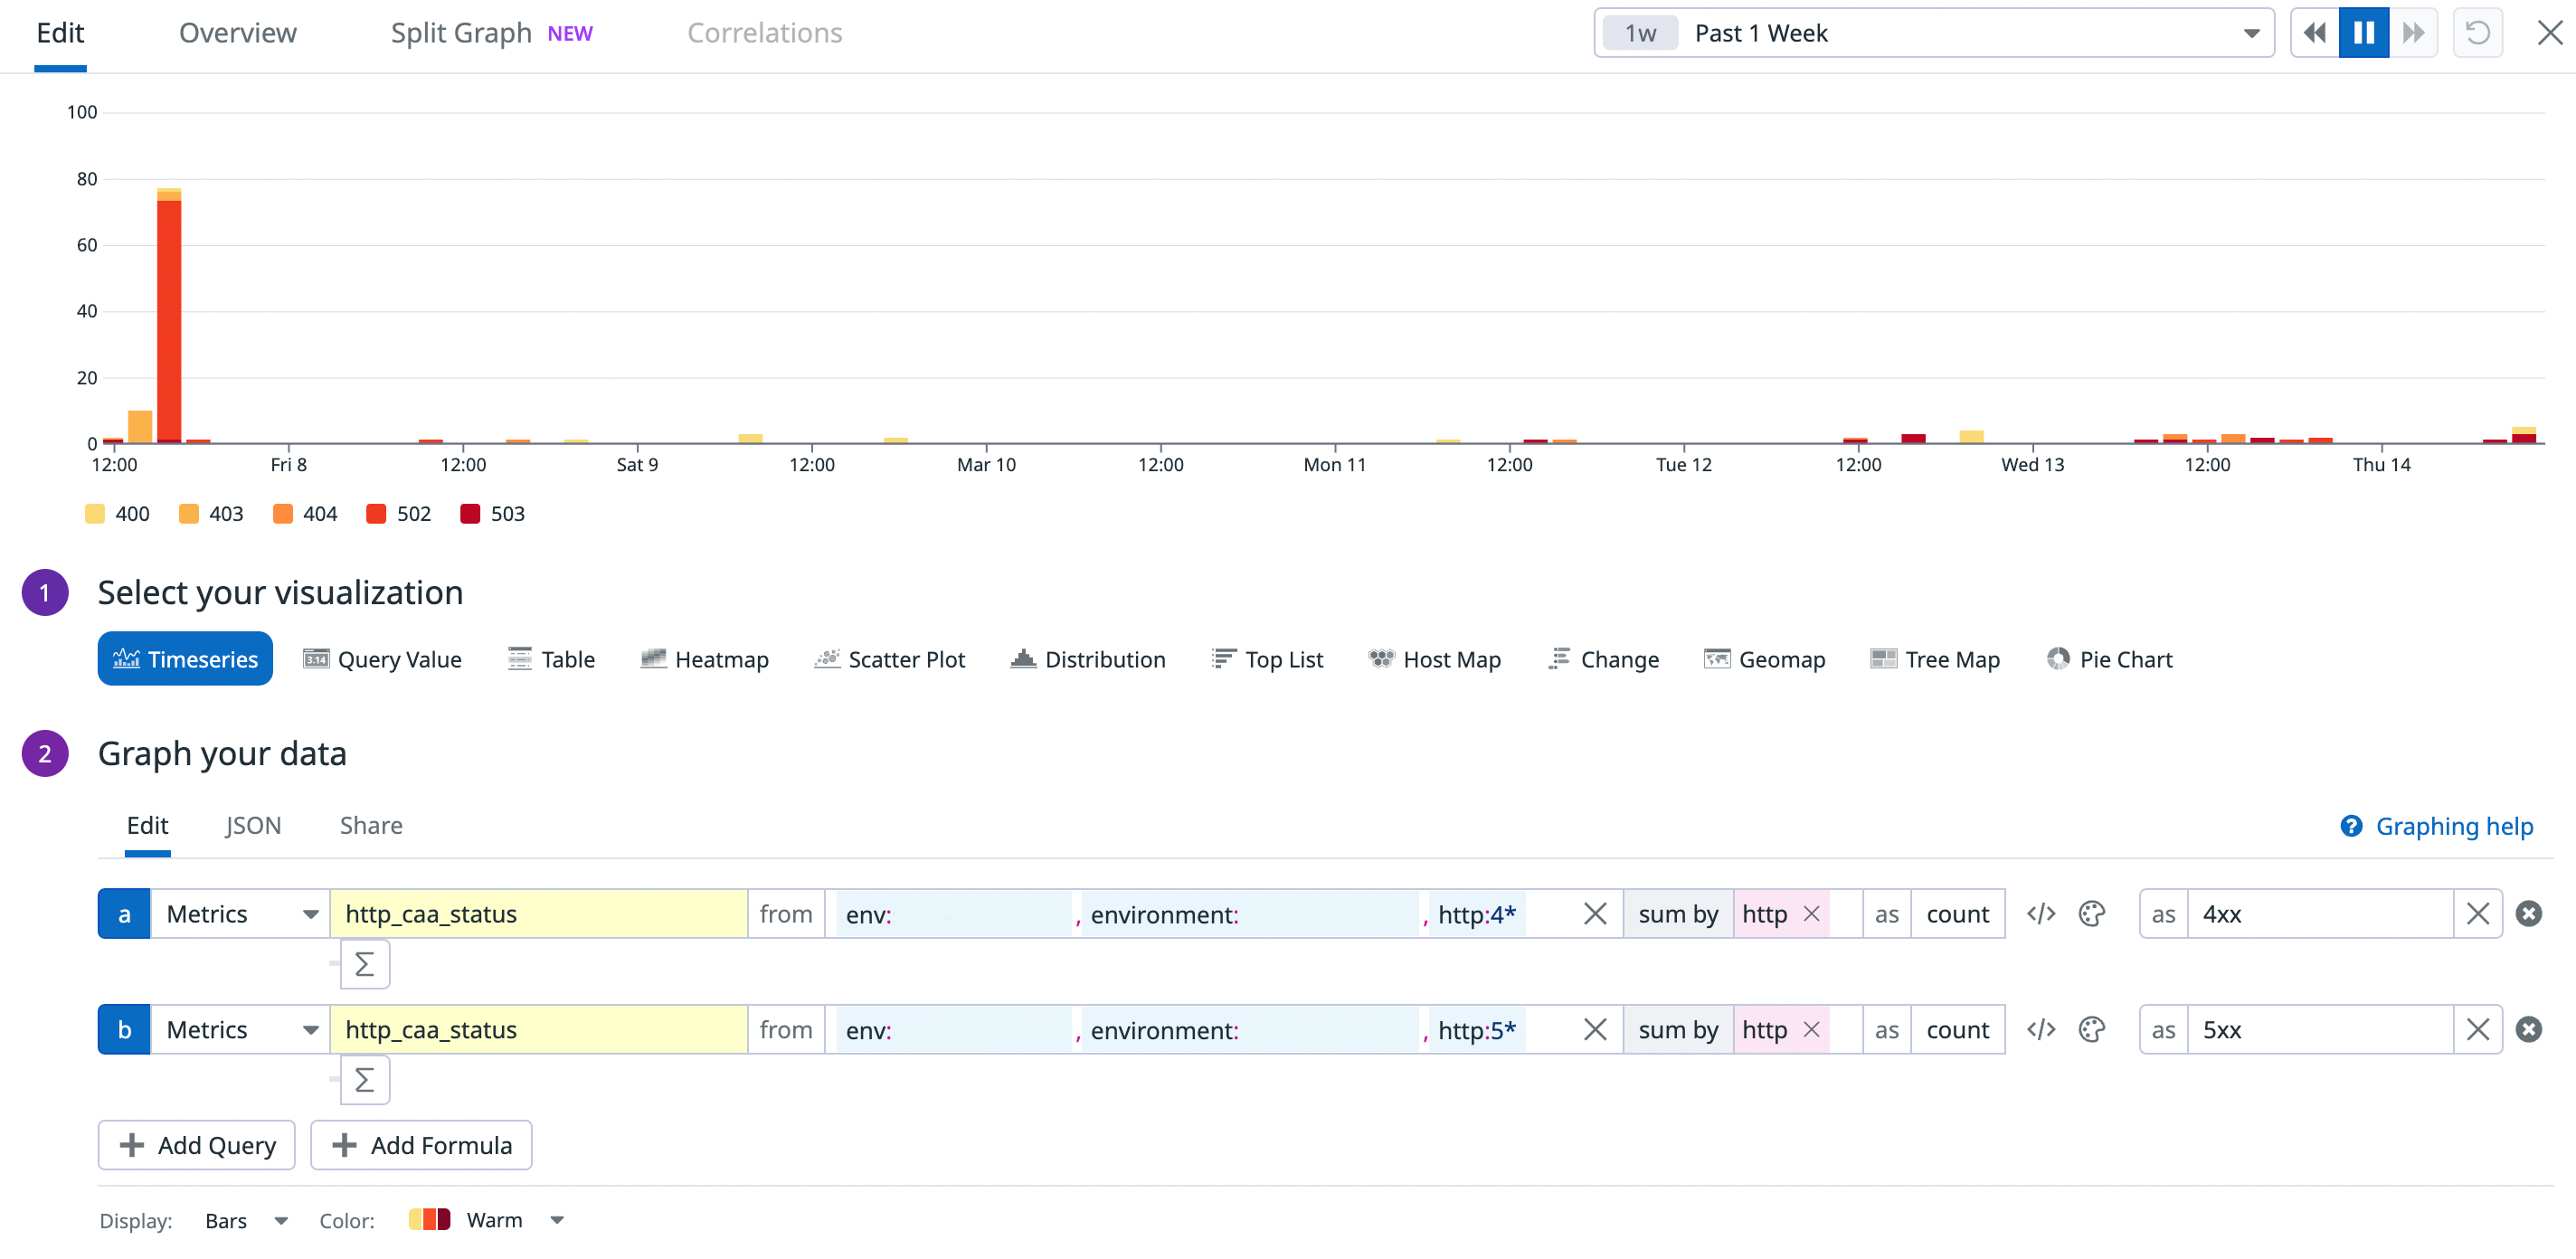
- Status code
So, based on the custom metric namespace above, each metric will be named as:
http_integration_latencyhttp_integration_througputhttp_integration_status
If you want to group your custom metric, Pigeon-http comes with several tags:
- host (can be IP address or domain name)
- http (HTTP status code)
- retry (retryable request)
TO DO: Make it configurable.
The image below will demonstrate how to create a simple graph using the gathered custom metrics:
