-
Notifications
You must be signed in to change notification settings - Fork 76
AX3 GUI
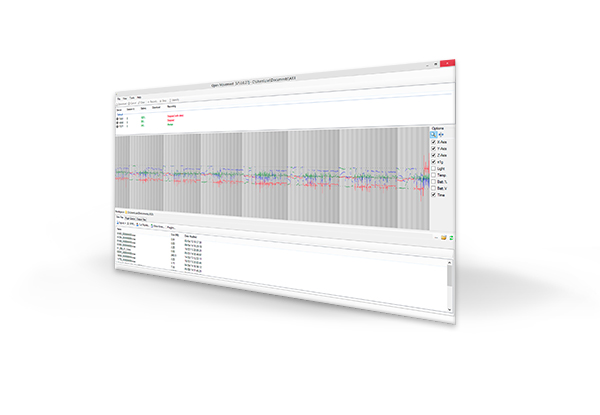
The AX3/AX6 OMGUI Configuration and Analysis Tool is an open source, lightweight application designed to provide the following functionality:
- Setup and configure AX sensors for recording
- Download and visualize recorded data from AX devices
- Provide an easy to use interface to convert binary AX recordings
- Provide access to validated analysis algorithms on recorded AX data
This document is intended as a guide to get to grips using the OMGUI software, learn about its features, and serve as a technical reference document.
For more information on using the AX devices for physical activity research, please see: AX Devices for Physical Activity Research
The OMGUI software is available from the open source GitHub repository:
V45 (revisions), Windows, zipped installer.
The system requirements for the OMGUI software are a Windows PC with XP SP3 or later operating system and Microsoft .NET Framework v3.5 or later. To install the software, open the downloaded archive and double-click the executable installer package.
Note: Administrator privileges will be required to install software. The default location for installation is
C:\Program Filesbut this can be changed to suit user- or system needs. If you have problems installing the software, please see the troubleshooting guide: Installation
To connect with a sensor you will need to install the drivers as well as the software. These drivers come packaged with the OMGUI software and are configured to install as default during the installation process. The software has an inbuilt facility to update itself for major releases as well as updating the firmware on connected devices.
The OMGUI software uses My Documents as a default working folder location, you can choose any folder to work from. If you need to share files with other users, consider using a shared or network drive location as the Working Folder. There is also an example data file available to download (place it in the working folder to run any analysis on it).
See also: Software for large-scale deployments.
OmGui can be installed using virtualization software (such as Parallels on Mac).
There is an experimental, cross-platform, web-based tool for configuring single devices: axconfig.
Data files can be downloaded by simply by mounting the AX device as USB-stick and copying (or moving off) the data file CWA-DATA.CWA from the devices.
You can process or export the data with omconvert or cwa-convert. You can also directly load the data into analysis environments with software such as: GGIR, openmovement-python, pampro, MATLAB or biobankAccelerometerAnalysis.
See also: Data Analysis
This section explains how to configure you device with the default settings and start collecting data. The default settings for configuration are:
- 100Hz logging
- Range ±8 g
- Start logging on sensor disconnect
This section then proceeds to cover downloading data and exporting to a CSV file with timestamps. For more in-depth instructions and explanations, please read the relevant sections of this manual.
See also: Open Movement Videos for demonstrations on using the software.
Connect the device and ensure it appears in the Device Browser Pane.
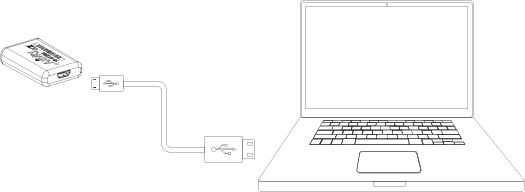
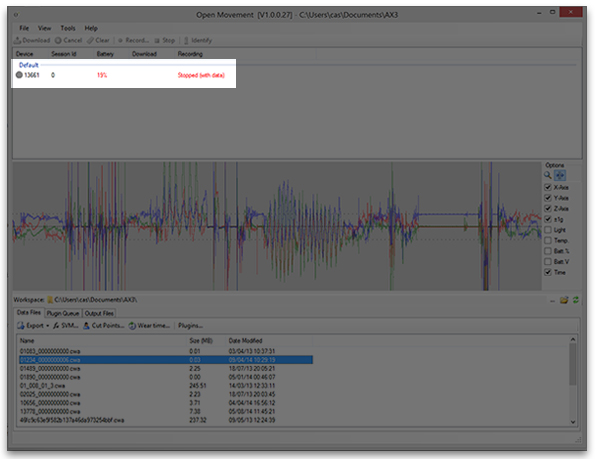
You may now Clear or Configure to Record as described in the following sections.
To remove any existing data that may be stored on the device, ensure the device is highlighted in the upper Device Browser Pane and left click the Clear button in the top-most Device Toolbar.
The sensor may be set to record in a variety of ways (covered later in this manual).
Ensure the device is highlighted in the upper Device Browser Pane and left click the Record... button in the top-most Device Toolbar (if this is not available, you may need to first Clear any unwanted existing data off the device).
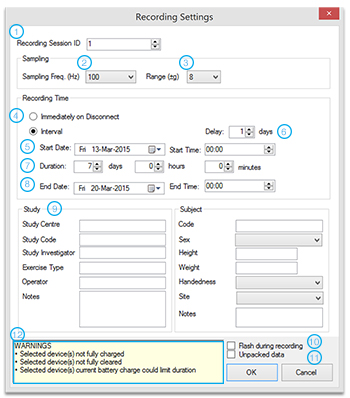
For default operation, the Recording Window is configured as shown. (To use the AX6 gyro, configure "Gyro (± dps)", 2000 as a default).
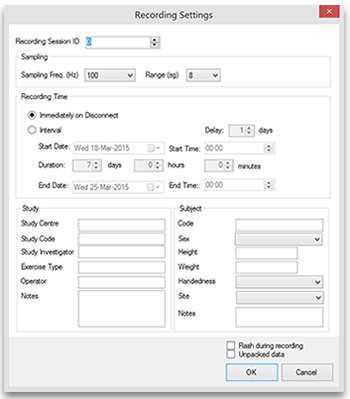
Once configured, click the OK button to set the configuration. If you keep the default settings, at this stage the device browser pane will show that the device is set to "Always" record. The device can now be disconnected and it will start recording immediately.
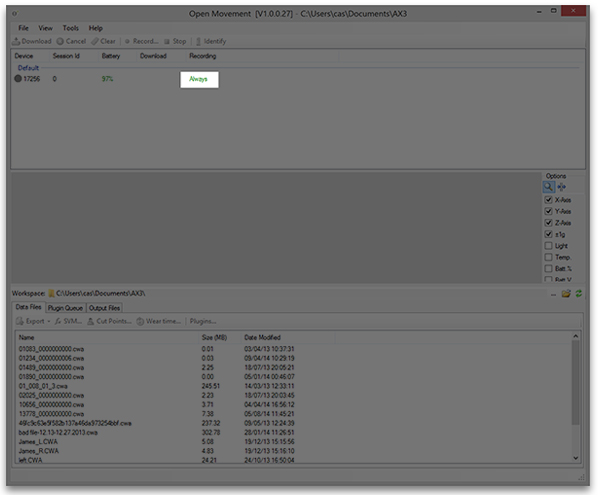
After the recording period the next step is to download the data from the device. To accomplish this, plug the device in to the USB port of the computer and wait for it to appear in the Device Browser Pane. If the device is still configured to record on disconnect, you will first have to click the Stop button. Next, click the Download button in the Device Toolbar. The file then start to download to your working folder. Once downloaded the file will appear in the Local Files Pane.
The data file is stored in an .CWA binary format. This format is not compatible with Excel or other third party software. To get it in a more friendly format it must first be converted using the Export function.
In order to use the raw data with a third-party software package, such as Excel, it must first be converted into a suitable format. This can be done using the Export Window. To instigate this, select the file in the Files Tab within the Local Files Pane and click Export button.
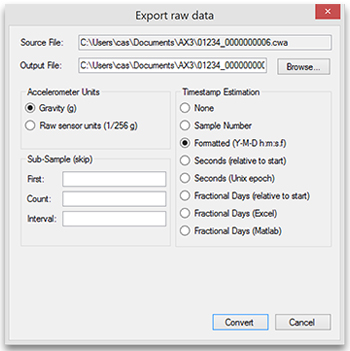
The following window will appear. Set the configuration as shown below and click the OK button to generate the file.
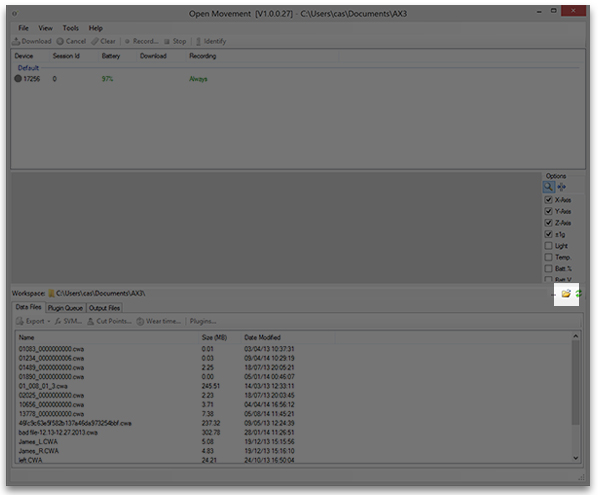
Files generated in using the Export function will appear in the Working Folder. To open the Working Folder, click the button shown below at the side of the Local Files Pane.
It is important to note that files exported to CSV format can become very large. Typically software such as Excel can only handle a few hours of data before it struggles. For multi-day recordings, the user should consider working directly with the binary files if developing algorithms, or if the user is happy with one of the existing inbuilt algorithms in the software, using summary measures. These will be covered later in this document.
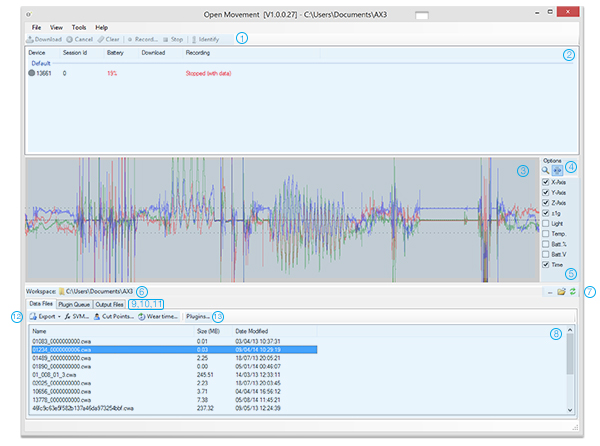
- Device Toolbar
- Device Browser Pane
- Data Preview Window
- Selection Tools
- Preview Filters
- Working Folder
- Working Folder Options
- Local File Browser Pane
- Data Files Tab
- Plugin Tab
- Output Tab
- Analysis Toolbar
- Plugins Button
For devices that have data stored on them, the Data Preview Window gives an overview of the recording and the Preview Filters on the right may be used to toggle data streams on or off.
The OMGUI software was programmed with the following functions in mind:
- Configuring sensors for recording
- Previewing and downloading data
- Analysis and data manipulation
The above topics will now be discussed in detail.
The OMGUI software displays all connected devices and their states in the Device Browser Pane. This information can be used for checking a devices current configuration as well as making sure the battery level is sufficient to complete the recording required.
NOTE: Best practice not to issue a device with less than 85% battery level.
With a device in the Device Browser Pane selected, the buttons on the Device Toolbar can be used to perform the following operations:
-
Download. If the connected device has any data recordings, this button downloads the recordings to the Working Folder.
-
Cancel. If the connected device is being downloaded, this button terminates the operation.
-
Clear. If the connected device has and data recordings, this button clears them. This operation is irreversible.
-
Stop. If the device is currently set to record, this button will clear the configuration so that when the device is disconnected it will enter into Standby mode.
-
Identify. This button will flash the LED on any selected device. It is designed to assist device identification when multiple devices are connected at once.
-
Record. This button is used to configure the device to record. The button brings up the Recording Window:
-
Recording Session ID. This field provides utility to mark the recording with a unique ID. This is useful in studies where patient data needs to be anonymized as the ID can be linked to a patient record.
-
Sampling Frequency. This is the number of times per second the sensor data will be recorded. For more information on choosing a sample frequency please see the sensor user manual. The default value is 100Hz which is adequate for most human movement studies.
-
Sampling Range. This is the maximum value that the sensor will record. For more information on choosing a range please see the sensor manual. The default setting is suitable for most human movement studies. To make gyroscope measurements (AX6 only), configure Gyro (± dps) (
2000as a default). -
Immediately on Disconnect. In this configuration the sensor will start recording as soon as it is unplugged from the computer.
-
Interval Start Date/Time. If the interval option is selected, the user can select a specific date and time to start recording on.
-
Interval Delay. In interval mode, the user can specify a number of days before the sensor will start recording with the present day as an index. For example “start recording in 2 days time”. The user is also able to directly select a date, and fine tune the start time using the Start Date/Time options.
-
Interval Duration. In interval mode, the user can specify a duration to record for. If the duration exceeds the physical capabilities of the device, a warning will be given.
-
Interval Stop Date/Time. In interval mode, the user can specify a specific date and time to stop recording on. If the duration exceeds the physical capabilities of the device, a warning will be given.
-
Study and Subject Meta Data. The device is able to store meta data along with the recorded data. This section provides the user provision to add a series of descriptive fields that will persist alongside the data recording; thus alleviating the possibility of metadata misalignment at a later date. All fields are optional in this section.
-
Flash during recording. If checked, this box will put the device in a mode whereby a small flash is periodically given when a device is actually recording (if an interval is set, the device will remain silent during the standby phase). Default is to have the device silently record to avoid wearer disruption.
-
Unpacked data. If checked, this option will configure the device to adopt a 6-bytes per sample format. Left unchecked (default) the device will adopt a 4 bytes per sample "packed" format, which enables it achieve a logging performance of 14 days at 100Hz with sufficient resolution for human movement studies.
-
Notes Area. This section is used for warnings to the user about any potential issues with the chosen configuration.
Any connected devices will appear in the Device Browser Pane marked as having data. When highlighted, data on these devices can be previewed in the Data Preview Window. There is a Zoom tool and Highlight tool in the Selection Tools section. In the Preview Filters section, a number of checkboxes exist to help the user visualize the data. On mousing over the data, the user is able to get a precise data preview at any given instant in the recording.
Recorded data stored on the sensor can be downloaded to the Working Folder by clicking the Download button. Download time is approximately 6 minutes for 7 days worth of data.
To open and view the contents of the Working Folder or change working folders, buttons are available in the Working Folder Options part of the interface.
Downloaded data will appear in the Data Files Browser Pane. This section of the interface displays all data files currently stored in the Working Folder. When a file is highlighted, a preview of the data is shown in the Data Preview Window. The OMGUI provides several ways for working with data:
- Export Function for working with data in an external analysis package
- Integrated algorithms (via Analysis Toolbar) for working with data via pre-validated algorithms
- Plugins for working with data via an externally developed analysis package within the OMGUI environment
Captured recordings are stored in a binary format that is not always directly compatible with external program environments. For this reason a built-in export facility is provided to enable captured recordings to be transcribed into various formats.
This option can be used to transcribe the binary format file into an audio WAVE file (WAV). In this format the data streams are interpolated over the recording duration. This is done via a bi-cubic spline algorithm. The WAV converter re-samples the binary data file produced on-board the accelerometer to produces a 4-channel (accelerometer-only) or 7-channel (accelerometer and gyroscope), 16-bit standard WAVE file. The first three channels correspond to the X-, Y- and Z-axes from the accelerometer (and a normalized -1 to 1 value must be scaled by the range setting, which can be obtained from the WAV header, with a default of 8 for +/- 8 g). When exporting with gyroscope data, the next three channels correspond to the X-, Y-, and Z-axes from the gyroscope (and a normalized -1 to 1 value must be scaled by the range setting, which can be obtained from the WAV header, e.g. 2000 for +/- 2000 dps). The last channel contains other information from the logging device, such as temperature, light and battery measurements -- encoded into the 16-bit values.
This operation can be used to convert a binary file into a CSV file format with a fixed sample period; useful for analysis that cannot handle variable sample rates. A bi-cubic interpolation is used to determine timestamps.
NOTE: CSV files of samples are considerably larger than binary counterparts and thus consideration to memory requirements must be given when using them. Binary WAV files should be preferred where it is possible to use them.
The output format for accelerometer data is:
Time,Ax,Ay,Az
...and for accelerometer/gyroscope data is:
Time,Ax,Ay,Az,Gx,Gy,Gz
Accelerometer units are in g (=9.81 m/s/s), while gyroscope units are in degrees/second.
The Export Raw function allows a destination to be chosen, and has a separate window where a variety of export options can be chosen:
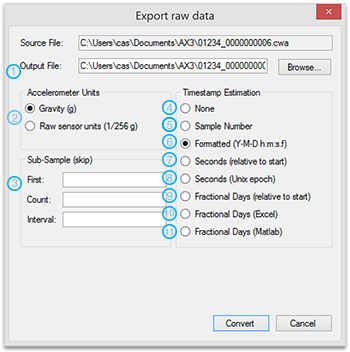
The following options are available on the Export Raw Window
-
Output File Path. This is the location where the output file will be placed. The user must have write permission to this location.
-
Accelerometer Units. The exporter provides utility to provide either the accelerometer readings as raw sensor values, or in units of g (=9.81 m/s/s).
-
Sub-Sample. Using the Selector Tool in the Data Preview Window, a specified data slice can be passed to the export window. The start and end of this slice can be verified in this section of the window.
-
No Timestamp Information. Column 1, 2 and 3 of the CSV file will be X, Y, Z accelerometer axis respectively. (If exporting Gyro data, columns 4, 5 and 6 will be the X, Y, Z gyroscope axes).
-
Sample Number will generate an incrementing number in column 1. Column 2, 3 and 4 will be X, Y, Z accelerometer axis respectively.
-
Formatted will generate a timestamps formatted in ISO 8061 format (
YYYY-MM-DD hh:mm:ss.fff) in column 1. Column 2, 3 and 4 will be X, Y, Z accelerometer axis respectively. (If exporting Gyro data, columns 5, 6 and 7 will be the X, Y, Z gyroscope axes). -
Seconds (relative to start) will generate timestamps in seconds relative to the first sample in Column 1. Column 2, 3 and 4 will be X, Y, Z accelerometer axis respectively. (If exporting Gyro data, columns 5, 6 and 7 will be the X, Y, Z gyroscope axes).
-
Seconds (Unix epoch) will generate time in Unix format (POSIX time); seconds since epoch of 1st January 1970. Column 2, 3 and 4 will be X, Y, Z accelerometer axis respectively. (If exporting Gyro data, columns 5, 6 and 7 will be the X, Y, Z gyroscope axes).
-
Fractional Days (relative to start) will generate time in fractions of days relative to the first sample. Column 2, 3 and 4 will be X, Y, Z accelerometer axis respectively. (If exporting Gyro data, columns 5, 6 and 7 will be the X, Y, Z gyroscope axes).
-
Fractional Days (Excel) will generate time in fractions of days since the Microsoft Excel epoch (1st Jan 1900). Column 2, 3 and 4 will be X, Y, Z accelerometer axis respectively. (If exporting Gyro data, columns 5, 6 and 7 will be the X, Y, Z gyroscope axes).
-
Fractional Days (Matlab) will generate time in fractions of days since the Unix epoch (1st Jan 1970). This is the time format Matlab and R use. Column 2, 3 and 4 will be X, Y, Z accelerometer axis respectively. (If exporting Gyro data, columns 5, 6 and 7 will be the X, Y, Z gyroscope axes).
The Analysis Toolbar provides the user fast provision to work with a selection of validated algorithms within the OMGUI environment.
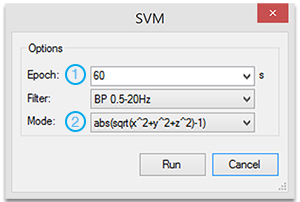
The signal vector magnitude (SVM) has been shown to be a useful measure for working with when axis specific information is not required. The SVM can be calculated in conjunction with, or without, a bandpass filter. Options for using the SVM calculation are now explained:
-
Epoch. This is the length of time each SVM averaging is made over. Default is 60 seconds. If number of samples in the file does not fit into an exact integer of epochs, the last epoch will be partial.
-
Mode. The SVM calculation can be made in a mode where all negative values of the SVM are rectified: abs(sqrt(x^2 + y^2 + z ^2)-1), or discarded: max(0,sqrt(x^2 + y^2 + z ^2)-1)
The output of the SVM tool is a CSV file stored in the working folder.
In detail: the signal vector magnitude takes the accelerometer vector length from the euclidean distance of the three accelerometer axes, and subtracts the 1g expected from gravity while stationary:
SVM-1 = sqrt(x^2 + y^2 + z^2) - 1
This signal can (optionally) be improved by filtering for only frequencies of human movement, by applying a fourth-order Butterworth band-pass filter between 0.5Hz and 20Hz. Negative values are dealt with by either taking the 'absolute' value (default), or clipping them to zero. This value is aggregated into a mean measurement over user-defined epoch length (in seconds). The resulting means are then, either:
sum(abs(sqrt(x^2 + y^2 + z^2) - 1))
sum(max(0, sqrt(x^2 + y^2 + z^2) - 1))
For more details on the SVM algorithm and the selection of apporpriate cut-points see 1.
When using the accelerometers to measure physical activity, time spent in specific states has been demonstrated to be a useful output. The Cut-point analysis reports the time user has spent in a specific intensity of physical activity where each intensity band is categorized in units of Metabolic Equivalent of Task (METS).
| Activity Level | MET Threshold |
|---|---|
| Sedentry | < 1.5 |
| Light | 1.5 < and < 3.99 |
| Moderate | 4.0 < and < 6.99 |
| Vigorous | 7.0 < |
1 MET = 3.5 ml O2 . kg^-1 . min ^-1 which is the equivalent of 58.2 W/m^2 or the rate of energy produced per unit surface area of an average person seated at rest.
To provide utility of converting accelerometry data into METS for specific population groups and for specific mounting sites of the sensor, the following interface is provided:
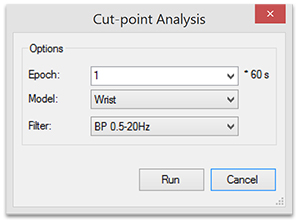
This algorithm is based on that proposed in 2, which takes an abs(SVM-1) values at 80Hz summed over 60 seconds. Our implementation compares the mean SVM over 60 seconds against 'cut points' which divide the results into time spent in activity levels: sedentary (< 1.5 METS), light (>= 1.5 METS, < 4 METS), moderate (>= 4 METS, < 7 METS), and vigorous (>=7 METS). The results are summed over user-defined multiples of the 1-minute epoch.
Custom cut-point values can be specified by pasting over the text in the "Model" line. For example, the cut-point values listed at: omconvert - cut-points.
The wear time validation (WTV) algorithm is designed to give a high level view if the device has been worn or not. It is unspecific to mounting site and based on the accelerometer readings. A screen-shot of the interface is give below.
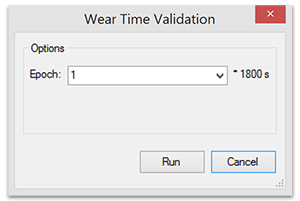
The algorithm is based on the method proposed in 2, where accelerometer non-wear time is estimated from the standard deviation and range of each accelerometer axis calculated over 30-minute periods. Each period is classified as non-wear time if the standard deviation was less than 3.0 mg for at least two out of the three axes, or if the value range, for at least two out of three axes, was less than 50 mg. The results are summed for user-defined multiples of 30 minute intervals.
The units reported in the WTV are the sum of the number of 30min windows detected within the epoch period. For example, if the epoch period is 1 hour and the sensor is worn continuously, the result will be 2. If the sensor is worn for the first 30 mins and then removed, the result will be 1. In the WTV process, windows are non-overlapping and treated as discrete chunks.
An implementation of the "Estimation of Stationary Sleep-segments" approach from:
Marko Borazio, Eugen Berlin, Nagihan Kucukyildiz, Philipp M. Scholl and Kristof Van Laerhoven: "Towards a Benchmark for Wearable Sleep Analysis with Inertial Wrist-worn Sensing Units", ICHI 2014, Verona, Italy, IEEE Press, 2014.
The algorithm detects periods of sleep. For more advanced uses, you may find the omsummary tool useful.
Plug-ins provide a way for developers to develop their own algorithms in their choice of environment and link them into the OMGUI interface. If you are interested in developing plug-ins or for more please consult the Open Movement source code pages at www.openmovement.co.uk.