DataCap and CID Checker Report1
- Organization:
BeijingZhongnong Leaf Eating Grass Natural Science Research Institute - Client:
f1sapvfym7hgcnydd7j6jnynspdhxo5j3m2fqmrra
1DaYouGroup1EVS20241ipollo001nj-steve2Normalnoise2SuperChaiChai2woshidama3232zcfil
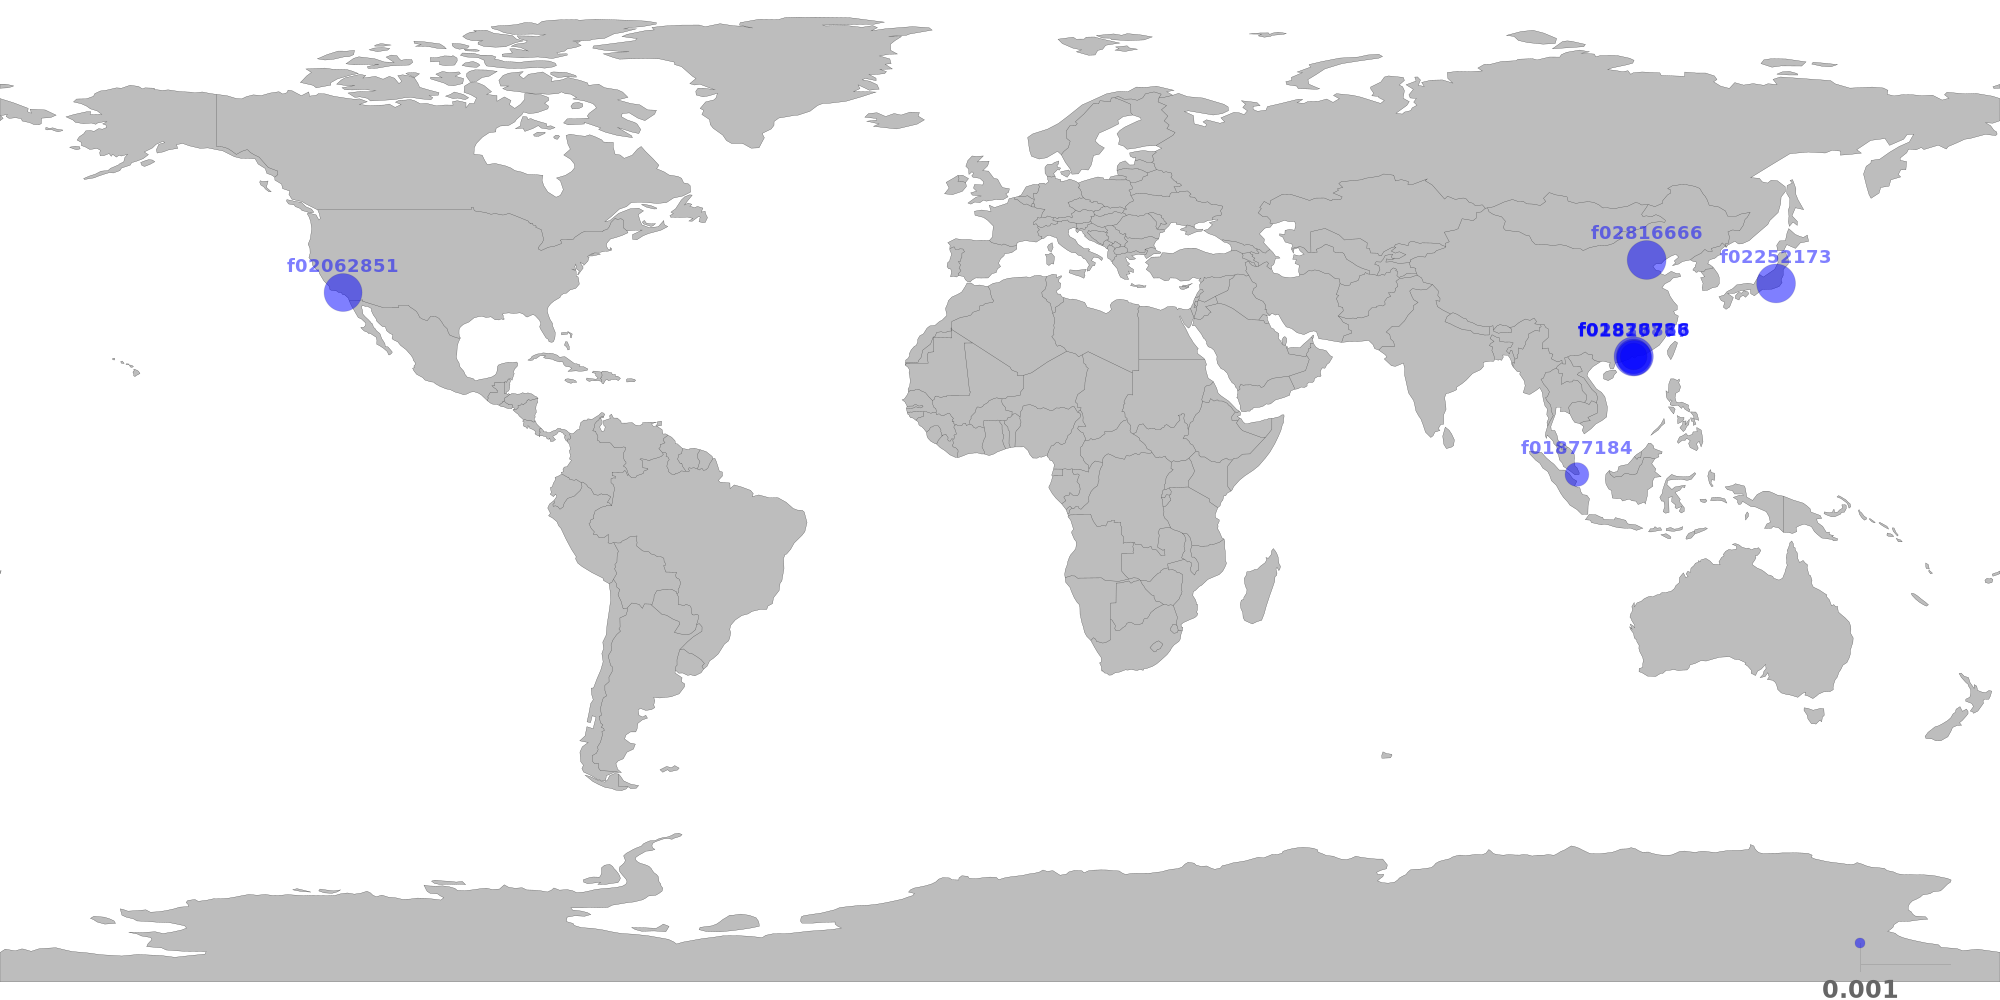
The below table shows the distribution of storage providers that have stored data for this client.
If this is the first time a provider takes verified deal, it will be marked as new.
For most of the datacap application, below restrictions should apply.
- Storage provider should not exceed 30% of total datacap.
- Storage provider should not be storing duplicate data for more than 20%.
- Storage provider should have published its public IP address.
- All storage providers should be located in different regions.
✔️ Storage provider distribution looks healthy.
| Provider | Location | Total Deals Sealed | Percentage | Unique Data | Duplicate Deals |
|---|---|---|---|---|---|
| f01877184 | Singapore, Singapore, SGAlibaba (US) Technology Co., Ltd. |
31.34 TiB | 0.60% | 31.34 TiB | 0.00% |
| f02252173 | Tokyo, Tokyo, JPAwesomecloud Limited |
1.11 PiB | 21.71% | 1.09 PiB | 2.06% |
| f01836766 | Shenzhen, Guangdong, CNCHINANET-BACKBONE |
1.25 PiB | 24.39% | 1.15 PiB | 8.06% |
| f02828888 | Shenzhen, Guangdong, CNCHINANET-BACKBONE |
350.28 TiB | 6.66% | 320.25 TiB | 8.57% |
| f01970716 | Shenzhen, Guangdong, CNCHINANET-BACKBONE |
54.19 TiB | 1.03% | 54.13 TiB | 0.12% |
| f02816666 | Beijing, Beijing, CNHangzhou Alibaba Advertising Co.,Ltd. |
1.12 PiB | 21.87% | 1.10 PiB | 1.89% |
f02817777new |
Hong Kong, Hong Kong, HKHK Kwaifong Group Limited |
370.13 TiB | 7.04% | 369.91 TiB | 0.06% |
| f02062851 | Los Angeles, California, USNetLab Global |
878.28 TiB | 16.71% | 858.25 TiB | 2.28% |
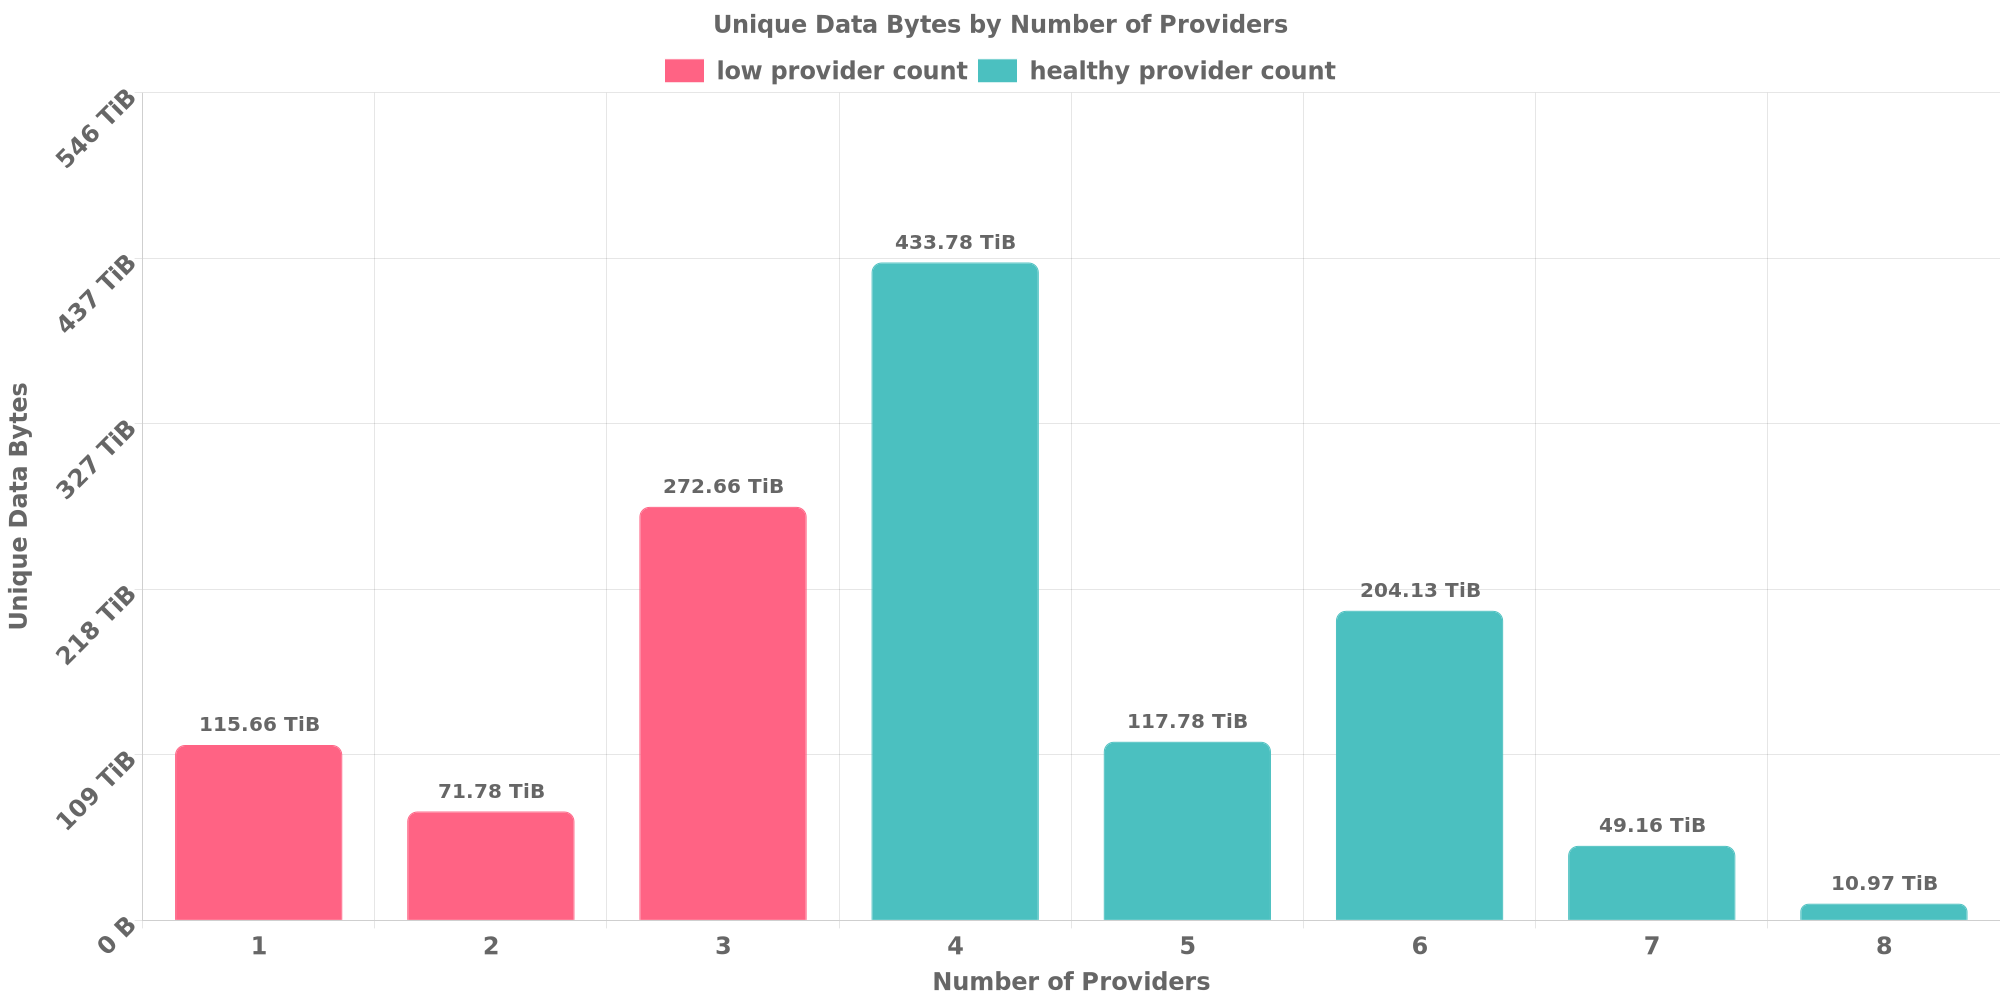
The below table shows how each many unique data are replicated across storage providers.
- No more than 30% of unique data are stored with less than 4 providers.
✔️ Data replication looks healthy.
| Unique Data Size | Total Deals Made | Number of Providers | Deal Percentage |
|---|---|---|---|
| 115.66 TiB | 116.13 TiB | 1 | 2.21% |
| 71.78 TiB | 143.59 TiB | 2 | 2.73% |
| 272.66 TiB | 820.25 TiB | 3 | 15.60% |
| 433.78 TiB | 1.72 PiB | 4 | 33.54% |
| 117.78 TiB | 633.69 TiB | 5 | 12.05% |
| 204.13 TiB | 1.28 PiB | 6 | 25.02% |
| 49.16 TiB | 375.31 TiB | 7 | 7.14% |
| 10.97 TiB | 89.13 TiB | 8 | 1.70% |
Deal Data Shared with other Clients2
The below table shows how many unique data are shared with other clients. Usually different applications owns different data and should not resolve to the same CID.
However, this could be possible if all below clients use same software to prepare for the exact same dataset or they belong to a series of LDN applications for the same dataset.
✔️ No CID sharing has been observed.

