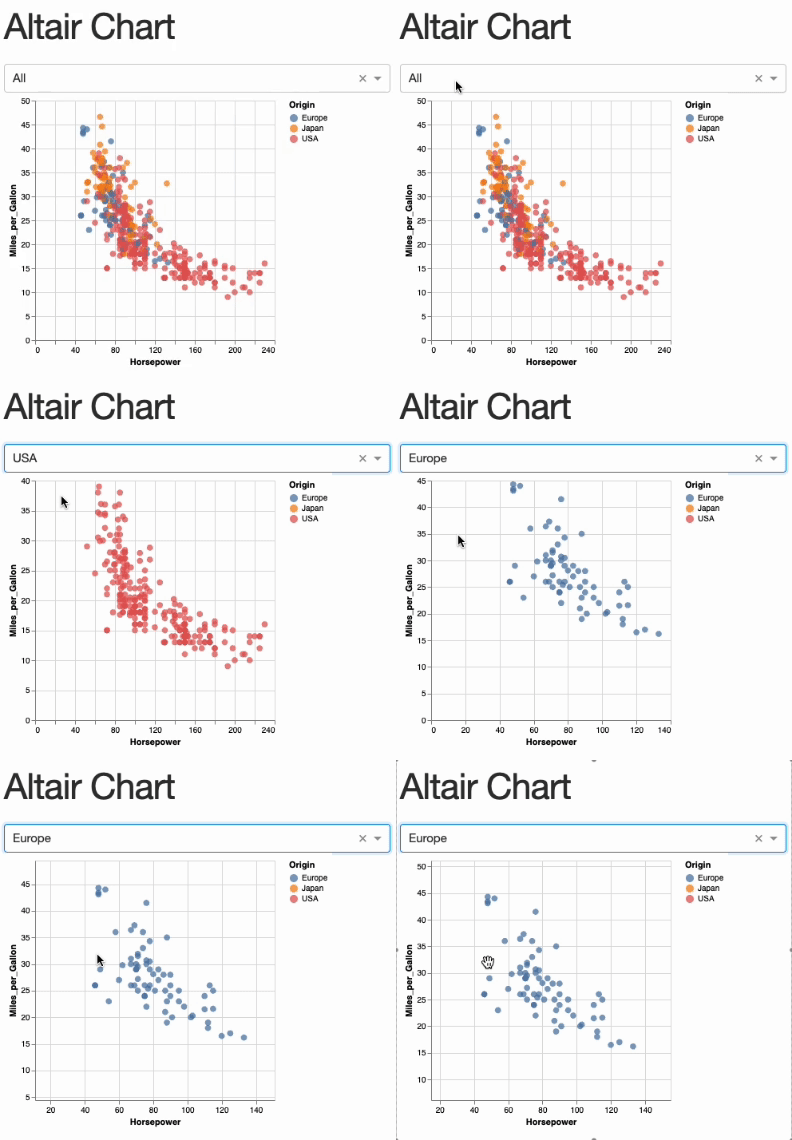
With the Vega component, you can display Vega-Altair charts in your Plotly Dash application. All features work as well with Vega-Lite and Vega specifications but the remainder of this README will focus on Altair as it is more common.
You can either go through the examples below or head over to the Plotly Dash documentation to learn more.
pip install dash-vega-componentsFor the example below, you'll also need:
pip install altair vega_datasetsimport altair as alt
from dash import Dash, Input, Output, callback, dcc, html
from vega_datasets import data
import dash_vega_components as dvc
# Passing a stylesheet is not required
app = Dash(
__name__, external_stylesheets=["https://codepen.io/chriddyp/pen/bWLwgP.css"]
)
app.layout = html.Div(
[
html.H1("Altair Chart"),
dcc.Dropdown(["All", "USA", "Europe", "Japan"], "All", id="origin-dropdown"),
# Optionally, you can pass options to the Vega component.
# See https://github.com/vega/vega-embed#options for more details.
dvc.Vega(id="altair-chart", opt={"renderer": "svg", "actions": False}),
]
)
@callback(Output("altair-chart", "spec"), Input("origin-dropdown", "value"))
def display_altair_chart(origin):
source = data.cars()
if origin != "All":
source = source[source["Origin"] == origin]
chart = (
alt.Chart(source)
.mark_circle(size=60)
.encode(
x="Horsepower",
y="Miles_per_Gallon",
color=alt.Color("Origin").scale(domain=["Europe", "Japan", "USA"]),
tooltip=["Name", "Origin", "Horsepower", "Miles_per_Gallon"],
)
.interactive()
)
return chart.to_dict()
if __name__ == "__main__":
app.run(debug=True)You can also pass a Vega or Vega-Lite specification as a dictionary.
Parameters are the basic building blocks to make an Altair chart interactive. They can either be simple variables or more complex selections that map user input (e.g., mouse clicks and drags) to data queries. In Vega, these are called Signals and the two concepts of Signals and Parameters are closely linked. As an Altair user, you don't have to know the details and you can think of them as synonyms.
You can trigger a Dash callback based on changes in any parameter which is defined in an Altair chart. To do this, you'll need to
- specify a
namewhen defining the parameter, for examplealt.param(name="my_param")oralt.selection_point(name="my_param") - add the parameter name to the
signalsToObserveproperty of theVegacomponent:dvc.Vega(id="chart1", signalsToObserve=["my_param]). If you want to observe all signals, you can also passsignalsToObserve=["all"] - use
Input("chart1", "signalData")in your callback to access the value of"my_param"and react to changes
For more examples, see example_app.py which shows how to filter a pandas dataframe based on a selection in a chart and display it in a Dash data table (the same would work with the Dash AG Grid component), or head over to #5.
Some ideas of what you could do with this:
- Filter a Dash data table based on the selected points in a scatter plot (see
example_app.py) - Based on a clickable bar chart, update other charts in your application
- If you have geographic data, show an overview map of aggregated regional data. Use this map as a navigation element in a dash multi-page app so that if a user clicks on e.g. the US, they get to the US specific subpage
- ...
For more infos on the properites of the Vega component, see its docstring in Vega.py.
To learn more about making Altair charts interactive, see Interactive Charts - Vega-Altair docs.
If you want your chart to resize responsively, set container="width" in your Altair chart.
Requires npm
python -m venv .venv
source .venv/bin/activate
pip install -r requirements.txt
pip install -r requirements-dev.txt

npm install
npm run build
# Test package with
python example_app.py
Visit http://localhost:8050 in your web browser
To cut a new release, see RELEASING.md
This package is based on the dash-component-boilerplate template.
