CPU ran into 200%+ in VSCode 1.18.0 #2124
Comments
|
On Windows 10, the same happens. |
|
Same on High Sierra 10.13. Opening a file creates 2 CodeHelper processes with 100%+ CPU usage. |
|
Yep. Same on High Sierra, also on VSCode Insiders |
|
Same occurs on macOS 10.12.6 |
|
I've got the same problem on Ubuntu 17.10. I disabled "Easy motion", I.E added So it looks like an issue with "Easy Motion". Ignore the above. It hasn't fixed it. The CPU stays down until you start moving the cursor around in the source file, once you do that the CPU rises again and stays up. Last Attempt I open the User settings and quit VS Code. Then start it up again, open my Ruby source file and start editing, everything is fine, CPU is low. Play around for a while, quit and restart. Now the problem starts again. It seems that if VS Code has a source file active when it starts up then the problem occurs but if you start it up with the user settings as the active pane and then open a source file you are ok. Can anybody else confirm this behaviour or am I going slightly crazy- its been a long day. |
|
@colbell confirmed, if I open it with any source file active even a blank one CPU usage spikes, if i open the user settings tab and relaunch CPU is low. I can consistently reproduce this, switching to a source code tab after launch, or having source code tabs open (regardless of tab order) at launch CPU still remains low, it seems this occurs only when a source code based tab has focus on launch. |
|
I have my CPU going crazy whenever a file is focused or vscode is re-open with a prev file opened. once I have any file opened CPU usage spikes. |
|
Same for me on Sierra 10.12.6, running VS code 1.18.0. |
|
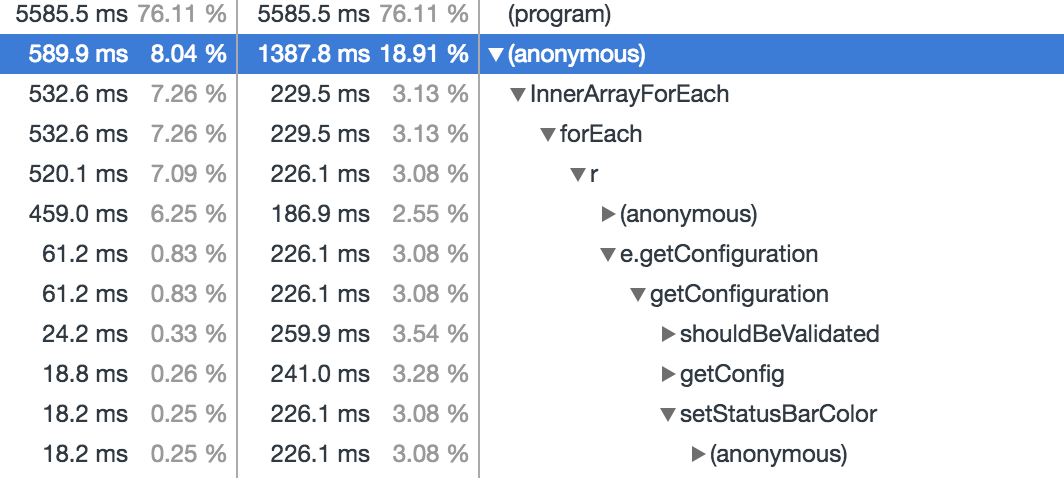
Have the same thing. Arrived at Vim extension by elimination of extensions. Profiled the extension and got this:
Which hints at my customising the status bar colors. Removed my config and everything is normal again! |
|
Disabling custom status bar colors corrected the problem for me also. |
|
@jondot Great job! I just disabled the customize status bar colors, everything goes well! |
|
Nice one @jondot disabling the colours fixed it for me too. |
|
confirm that |
|
I can reproduce consistently on Just tested in @MythicalFish can you still repro? I can't find a PR relevant to this issue landing in vscode from the past few days - which I find strange https://github.com/Microsoft/vscode/pulls?utf8=%E2%9C%93&q=is%3Apr%20is%3Aclosed%20closed%3A%3E2017-11-07 |
|
same for me on |
|
I am experiencing a phenomenon that the CPU becomes higher after vscode 1.18 update in the Win10 environment. |
|
It was the vim extension causing the 100% CPU usage issue for me also. Removing any/all "neovim" related settings took care of the problem. Just changing some to a 'disabled' value or just commenting out did not work. I had to totally remove then entries. |
|
Does anybody still get this issue on recent versions of VSCodeVim? |
|
I still experienced this issue in 1.21.1 and for me it was fixed by commenting out the |
|
@stevebasford that setting is deprecated, it was removed awhile ago. Closing this issue as it seems resolved. |
|
I was brought here by the below link (about 2/3 of the way down the page, in the emulated-plugins section), thinking I couldn't use vim-airline with VSCodeVim. It seems this no longer affecting vim-airline, yes? Might be best to remove the disclaimer at the top of the emulated-plugins section https://marketplace.visualstudio.com/items?itemName=vscodevim.vim#-emulated-plugins |
|
From my experience it depends on the machine you are using. Maybe it was worse in 2017 regardless of your machine, but it is still an issue. |
|
I'd recommend sticking a 👍 on microsoft/vscode#43226 if you want to be able to enable statusbar colours without performance issues. |
|
Could this recent change solve this? |
|
@nzig that blog post says:
so it looks to me like that'd be of limited use... FWIW I managed to find a solution to color the status bar item based on its text, using the Customize UI extension: "customizeUI.stylesheet": {
"#vscodevim\\.vim\\.primary[aria-label=\"-- INSERT --\"]": "background-color: #98971a !important;",
"#vscodevim\\.vim\\.primary[aria-label=\"-- VISUAL --\"]": "background-color: #b16286 !important;",
"#vscodevim\\.vim\\.primary[aria-label^=\":\"]": "background-color: #7c6f64 !important;",
},result:
|


For some reason this does not work for me. How do you find those values ("#vscodevim\..."). Maybe those are different now. |
They are indeed! It's I found them by opening the developer tools (Ctrl-Shift-P, "Developer: Toggle Developer tools") and then using the picker at the top left of the "Elements" tab to inspect the element. |
|
FYI, Customize UI no longer works so that option is off the table :( I'd love to get something along these lines, as I'm often not noticing which mode I'm in, even with different cursors for insert vs normal. |
I switched to be5invis/vscode-custom-css which still works (though since the CSS is placed in a normal file with it, use |
I seriously love your solution, I modified it a bit to color the whole status bar to make it more visible of a change. |
|
An easy alternative solution is to install and give permissions to Apc Customize UI++ and add the following to {
"apc.stylesheet": {
/* Default footer style */
".part.statusbar.status-border-top": "background-color: rgb(143, 188, 187); color: rgb(67, 76, 94);",
/* Apply styles based on aria-label in the footer */
".part.statusbar.status-border-top [aria-label='-- NORMAL --']": "background-color: #8FBCBB; color: #434C5E;",
".part.statusbar.status-border-top [aria-label='-- INSERT --']": "background-color: #BF616A; color: #434C5E;",
".part.statusbar.status-border-top [aria-label='-- VISUAL --']": "background-color: #B48EAD; color: #434C5E;",
".part.statusbar.status-border-top [aria-label='-- VISUAL LINE --']": "background-color: #B48EAD; color: #434C5E;"
}
} |
Really helpful answer, because I belive if you use the "vim.statusBarColorControl" option then you cannot use "extensions.experimental.affinity" correctly because it keeps updating the settings.json. I added a few things to your settings hope it helps, feel more complete now. "apc.stylesheet": {
/* Apply styles based on aria-label in the footer */
"#vscodevim\\.vim\\.primary": "padding: 0 4px;",
"#vscodevim\\.vim\\.primary[aria-label='Already at oldest change']": "background-color: #475569; color: #d1d5db;",
"#vscodevim\\.vim\\.primary[aria-label^='-- NORMAL']": "background-color: #8FBCBB; color: #434C5E;",
"#vscodevim\\.vim\\.primary[aria-label='-- INSERT --']": "background-color: #BF616A; color: #e5e7eb;",
"#vscodevim\\.vim\\.primary[aria-label='-- VISUAL --'], #vscodevim\\.vim\\.primary[aria-label='-- VISUAL LINE --']": "background-color: #B48EAD; color: #e5e7eb;",
"#vscodevim\\.vim\\.primary[aria-label='-- VISUAL BLOCK --']": "background-color: #A3BE8C; color: #434C5E;",
"#vscodevim\\.vim\\.primary[aria-label='-- REPLACE --']": "background-color: #D08770; color: #434C5E;",
"#vscodevim\\.vim\\.primary[aria-label='-- EASYMOTION INPUT --'], #vscodevim\\.vim\\.primary[aria-label='-- SURROUND INPUT --']": "background-color: #007ACC; color: #e5e7eb;",
"#vscodevim\\.vim\\.primary[aria-label^=':'], #vscodevim\\.vim\\.showcmd": "color: #fafafa;"
} |
|
I was only able to get expected output using the "Custom UI Style" extension and this snippet: "custom-ui-style.stylesheet": {
".statusbar-item-label[aria-label=\"-- NORMAL --\"], .statusbar-item-label[aria-label=\"-- SURROUND INPUT --\"], .statusbar-item-label[aria-label=\"-- EASYMOTION INPUT --\"], .statusbar-item-label[aria-label='Already at oldest change'], .statusbar-item-label[aria-label=':nohlsearch']": "background-color: #89b4fa !important; color: #181825 !important",
".statusbar-item-label[aria-label=\"-- INSERT --\"]": "background-color: #a6e3a1 !important; color: #181825 !important",
".statusbar-item-label[aria-label=\"-- REPLACE --\"]": "background-color: #f38ba8 !important; color: #181825 !important",
".statusbar-item-label[aria-label=\"-- VISUAL --\"], .statusbar-item-label[aria-label=\"-- VISUAL BLOCK --\"], .statusbar-item-label[aria-label=\"-- VISUAL LINE --\"]": "background-color: #cba6f7 !important; color: #181825 !important",
".statusbar-item-label[aria-label^=':']": "background-color: #f9e2af !important; color: #181825 !important",
}, |
Thanks a lot! |
The VSCodeVim team prioritizes issues based on reaction count.
Is this a BUG REPORT or FEATURE REQUEST? (choose one): BUG REPORT
Environment:
What happened:
When I upgrade to VSCode 1.18.0 the CPU ran into extreme high, I found it caused by two
Code Helper.appprocesses. Then I just disabled all extensions, everything is OK. It is clear that this issues is caused by extensions conflicts with VSCode, so I re-enabled each extension to figure out which one caused this situation. Finally I found it is VSCodeVim, I just re-enabled every other extensions everything is OK, but after re-enable VSCodeVim, the CPU went high.So I don't know do you guys have the same issue?
What did you expect to happen:
Normal CPU usage.
How to reproduce it:
The text was updated successfully, but these errors were encountered: