-
Notifications
You must be signed in to change notification settings - Fork 532
Performance
In this part, we are going to show some of the performance tests with Dynomite. This section is divided
One of our top priorities of Dynomite is to be able to scale a data store linearly with growing traffic demands. We have a symmetric deployment model at Netflix where Dynomite is deployed in every AWS zone and sized equally, as in same number of nodes in every zone. We want the capability to simultaneously scale dynomite in every zone linearly as traffic grows in that region.
We conducted a simple load test to prove this ability of Dynomite.
Client (workload generator) Cluster
- Number of nodes: 24
- Region: us_east_1
- EC2 instance type: m3.2xlarge (30GB RAM, 8 CPU cores, Network throughput: high)
- Data size: 1024 Bytes
- Number of readers/writes: 50/50
- Read/Write ratio: 80/20 (the OPS was variable per test, but the ratio was kept 80/20)
- Demo application used a simple workload of just key value pairs for read and writes i.e the Redis GET and SET api.
- Number of Keys: 1M
Dynomite Cluster
- Data store: Redis 2.8.9
- Number of nodes: 3-48 (doubling every time)
- Region: us_east_1
- EC2 instance type: r3.2xlarge (61GB RAM, 8 CPU cores, Network throughput: high)
- Consistency: disabled (quorum_one)
- % of RAM used by data store: 95%

Details
- Server instance type was r3.xlarge. These instances are well suited for Dynomite workloads - i.e good balance between memory and network
- Replication factor was set to 3. We did this by deploying Dynomite in 3 zones in us-east-1 and each zone had the same no of servers and hence the same no of tokens.
- Client fleet used instance type as m2.2xls which is also typical for an application here at Netflix.
- Demo application used a simple workload of just key value pairs for read and writes i.e the Redis GET and SET api.
- Payload size was chosen to be 1K
- We maintained an 80% - 20% ratio between reads and writes which is also typical of many use cases here at Netflix.
We setup a Dynomite cluster of 6 nodes (i.e 2 per zone).
We observed throughput of about 80k per second across the client fleet:
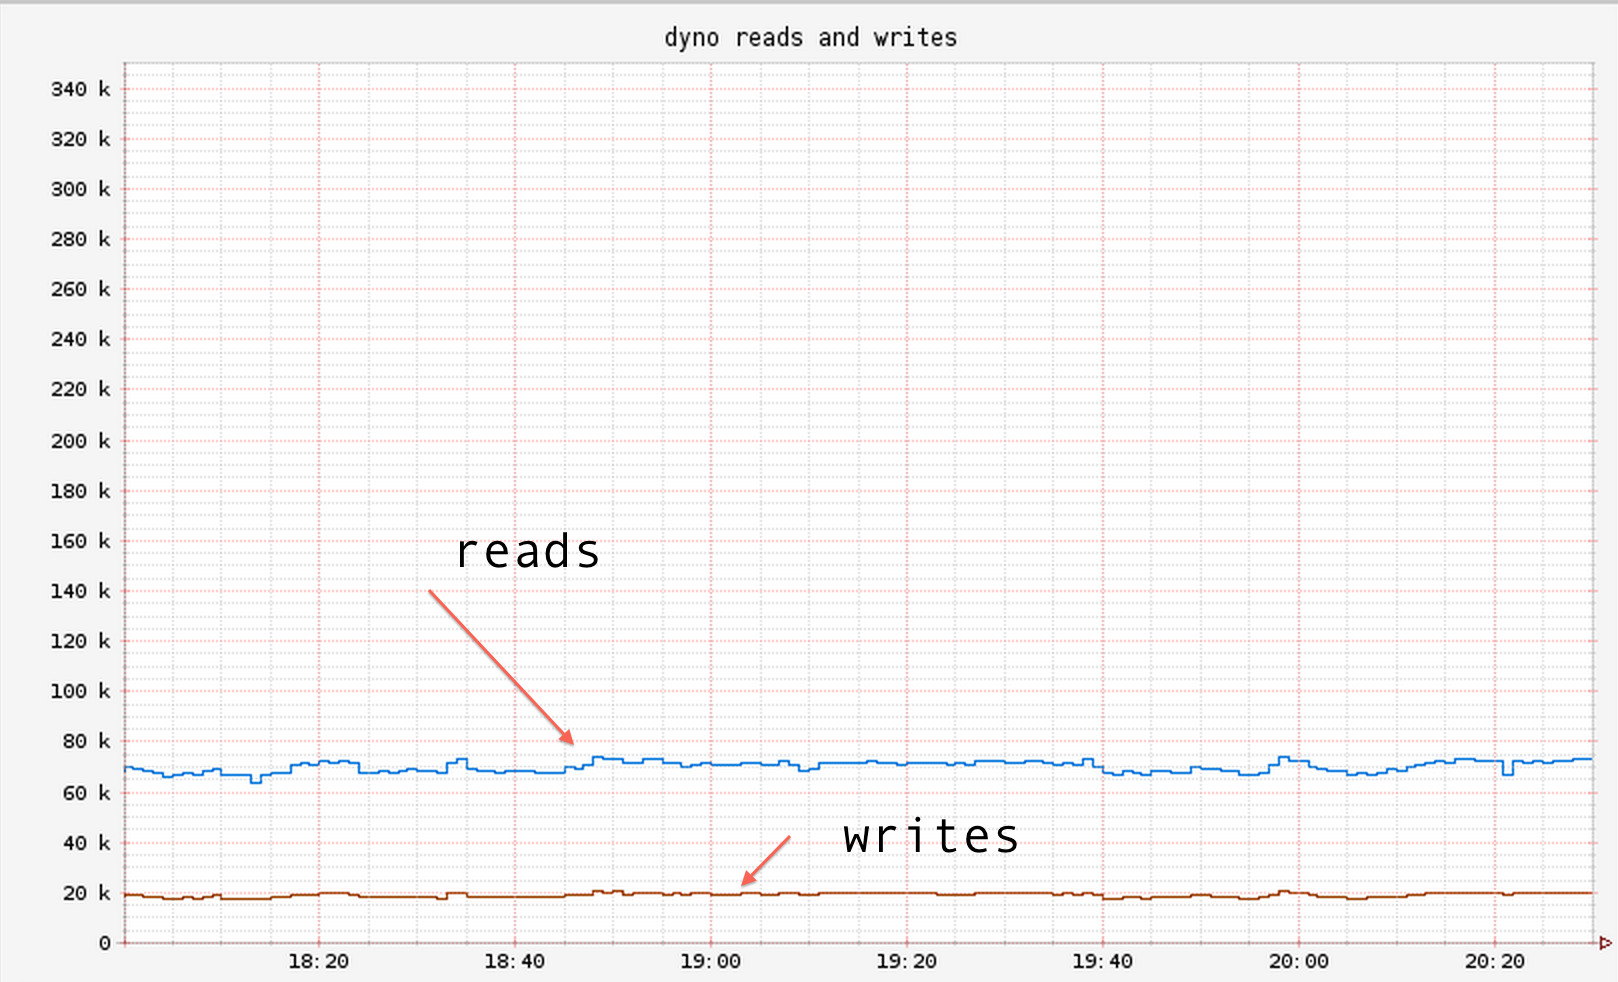
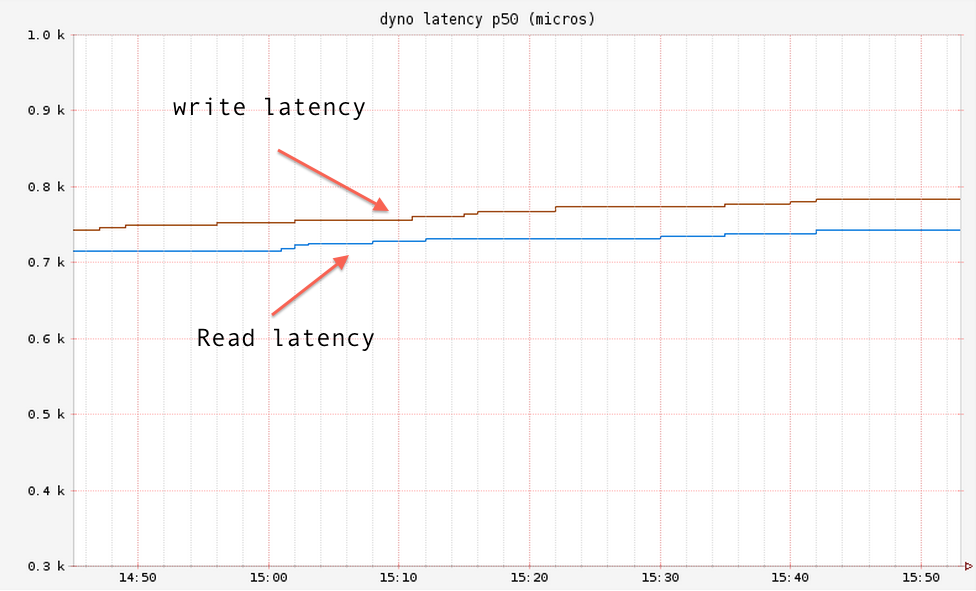
while keeping the avg latency ~1 ms:

and 99 percentile latency in the single digit ms range:
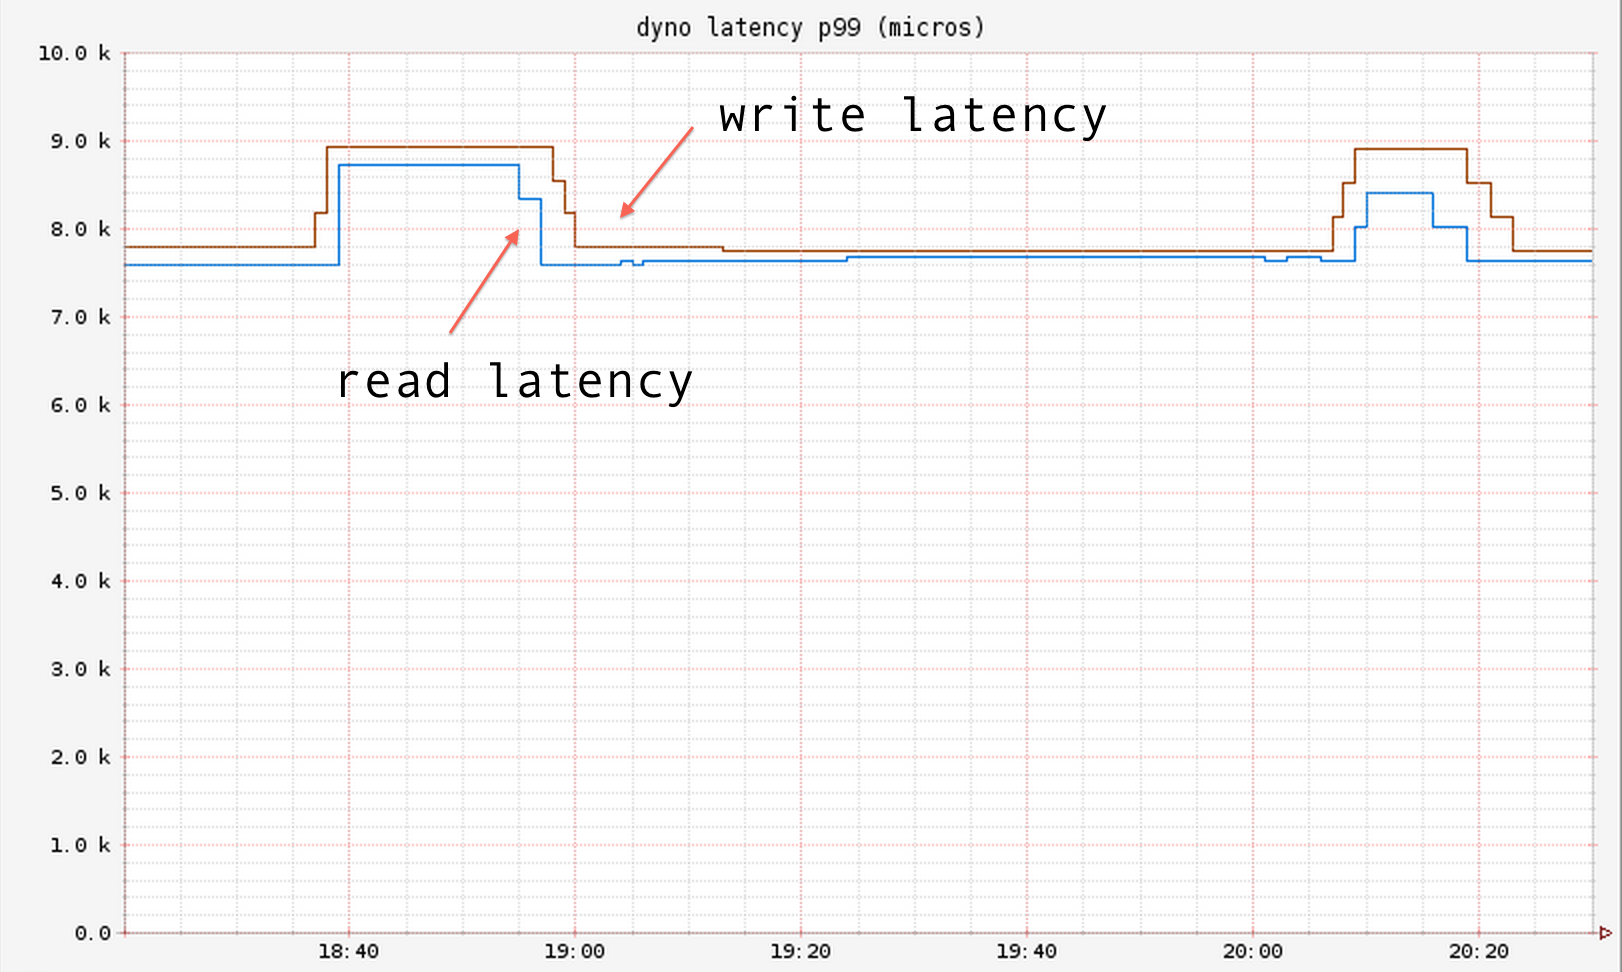
We then doubled the size of the Dynomite cluster from 6 nodes to 12 nodes. We also simultaneously doubled our client fleet to add more load on the cluster.
As expected client fleet throughput went up by 100%
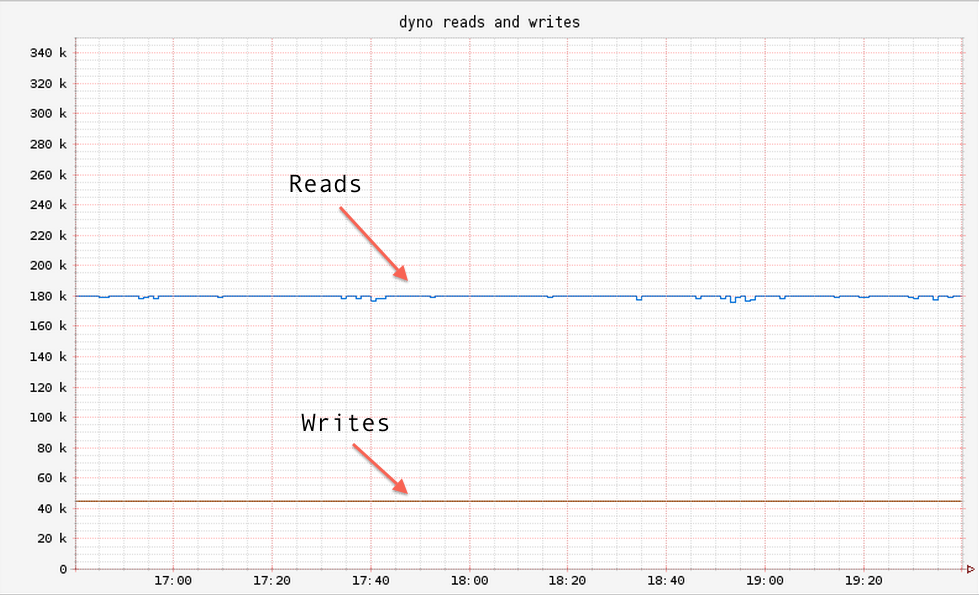
while still keeping avg and 99 percentile latencies in check

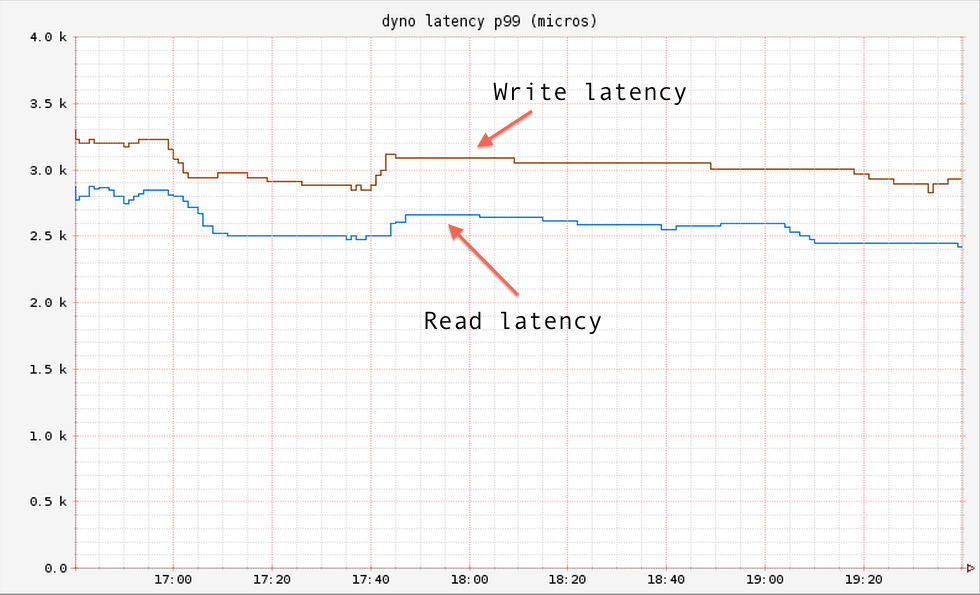
We then went for one more double for the server and client fleet and throughput went up by 100% once again,
while latencies remained the same.


In our initial tests, we measured the time it took for a key/value pair to become available on another region replica by writing 1k key/value pairs to Dynomite in one region, then polling the other region randomly for 20 keys. The value for each key in this case is just timestamp when the write action started. The client in the other region then reads back those timestamps and compute the durations. We repeated this same experiment several times and took the average. From this we could derive a rough idea of the speed of the replication.
We expect this latency to remain more or less constant as we add code path optimization as well as enhancements in the replication strategy itself (optimizations will improve speed, features will potentially add latency).
Result:
For 5 iterations of this experiment, the average duration for replications was around 85ms. (note that the duration numbers are measured at the client layers so the real numbers should be smaller).