-
Notifications
You must be signed in to change notification settings - Fork 5
/
chapter_4-2.qmd
815 lines (538 loc) · 53.1 KB
/
chapter_4-2.qmd
1
2
3
4
5
6
7
8
9
10
11
12
13
14
15
16
17
18
19
20
21
22
23
24
25
26
27
28
29
30
31
32
33
34
35
36
37
38
39
40
41
42
43
44
45
46
47
48
49
50
51
52
53
54
55
56
57
58
59
60
61
62
63
64
65
66
67
68
69
70
71
72
73
74
75
76
77
78
79
80
81
82
83
84
85
86
87
88
89
90
91
92
93
94
95
96
97
98
99
100
101
102
103
104
105
106
107
108
109
110
111
112
113
114
115
116
117
118
119
120
121
122
123
124
125
126
127
128
129
130
131
132
133
134
135
136
137
138
139
140
141
142
143
144
145
146
147
148
149
150
151
152
153
154
155
156
157
158
159
160
161
162
163
164
165
166
167
168
169
170
171
172
173
174
175
176
177
178
179
180
181
182
183
184
185
186
187
188
189
190
191
192
193
194
195
196
197
198
199
200
201
202
203
204
205
206
207
208
209
210
211
212
213
214
215
216
217
218
219
220
221
222
223
224
225
226
227
228
229
230
231
232
233
234
235
236
237
238
239
240
241
242
243
244
245
246
247
248
249
250
251
252
253
254
255
256
257
258
259
260
261
262
263
264
265
266
267
268
269
270
271
272
273
274
275
276
277
278
279
280
281
282
283
284
285
286
287
288
289
290
291
292
293
294
295
296
297
298
299
300
301
302
303
304
305
306
307
308
309
310
311
312
313
314
315
316
317
318
319
320
321
322
323
324
325
326
327
328
329
330
331
332
333
334
335
336
337
338
339
340
341
342
343
344
345
346
347
348
349
350
351
352
353
354
355
356
357
358
359
360
361
362
363
364
365
366
367
368
369
370
371
372
373
374
375
376
377
378
379
380
381
382
383
384
385
386
387
388
389
390
391
392
393
394
395
396
397
398
399
400
401
402
403
404
405
406
407
408
409
410
411
412
413
414
415
416
417
418
419
420
421
422
423
424
425
426
427
428
429
430
431
432
433
434
435
436
437
438
439
440
441
442
443
444
445
446
447
448
449
450
451
452
453
454
455
456
457
458
459
460
461
462
463
464
465
466
467
468
469
470
471
472
473
474
475
476
477
478
479
480
481
482
483
484
485
486
487
488
489
490
491
492
493
494
495
496
497
498
499
500
501
502
503
504
505
506
507
508
509
510
511
512
513
514
515
516
517
518
519
520
521
522
523
524
525
526
527
528
529
530
531
532
533
534
535
536
537
538
539
540
541
542
543
544
545
546
547
548
549
550
551
552
553
554
555
556
557
558
559
560
561
562
563
564
565
566
567
568
569
570
571
572
573
574
575
576
577
578
579
580
581
582
583
584
585
586
587
588
589
590
591
592
593
594
595
596
597
598
599
600
601
602
603
604
605
606
607
608
609
610
611
612
613
614
615
616
617
618
619
620
621
622
623
624
625
626
627
628
629
630
631
632
633
634
635
636
637
638
639
640
641
642
643
644
645
646
647
648
649
650
651
652
653
654
655
656
657
658
659
660
661
662
663
664
665
666
667
668
669
670
671
672
673
674
675
676
677
678
679
680
681
682
683
684
685
686
687
688
689
690
691
692
693
694
695
696
697
698
699
700
701
702
703
704
705
706
707
708
709
710
711
712
713
714
715
716
717
718
719
720
721
722
723
724
725
726
727
728
729
730
731
732
733
734
735
736
737
738
739
740
741
742
743
744
745
746
747
748
749
750
751
752
753
754
755
756
757
758
759
760
761
762
763
764
765
766
767
768
769
770
771
772
773
774
775
776
777
778
779
780
781
782
783
784
785
786
787
788
789
790
791
792
793
794
795
796
797
798
799
800
801
802
803
804
805
806
807
808
809
810
811
812
813
814
815
# 4.2 Anomaly Detection & Motion Classification {.unnumbered}
<br />
<!--  -->
## 4.2.1 Things used in this project
### Hardware components
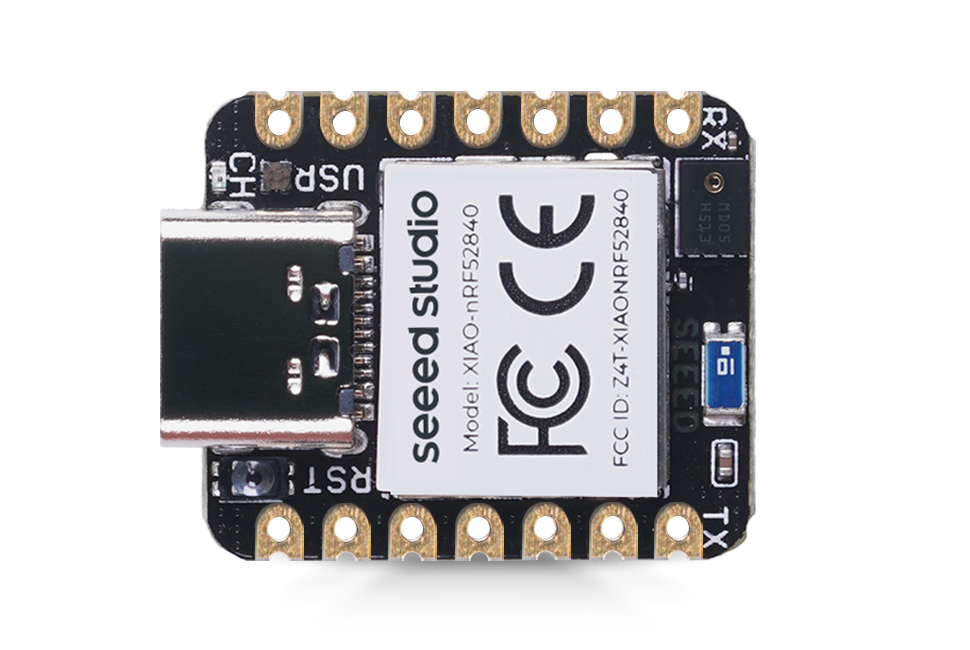
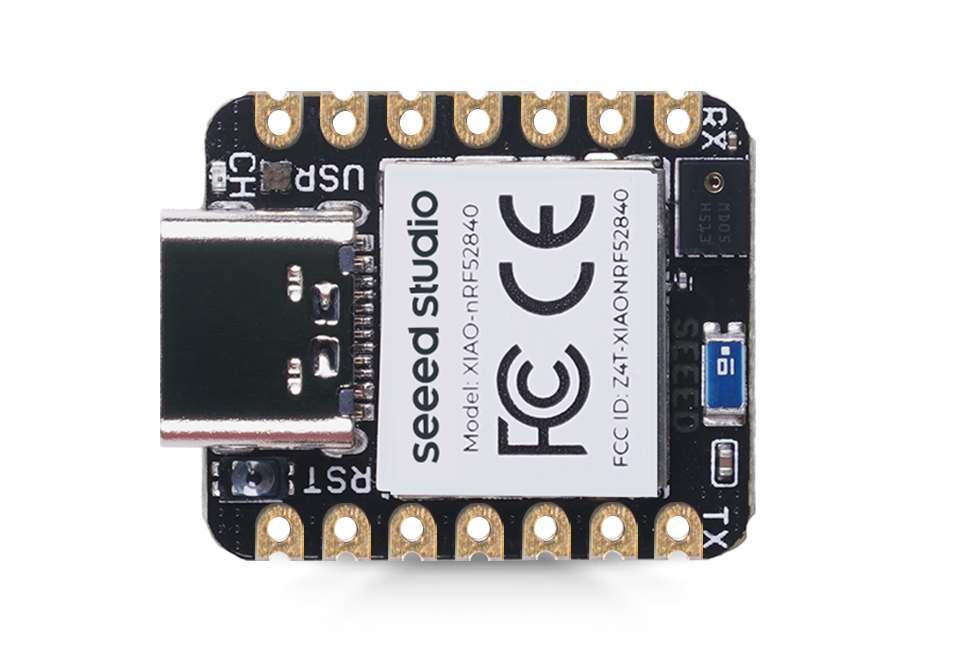
- [Seeed Studio XIAO nRF52840 Sense](https://www.seeedstudio.com/Seeed-XIAO-BLE-Sense-nRF52840-p-5253.html) × 1
<!--  -->
<!--  -->
<img src="https://files.seeedstudio.com/wiki/XIAO_Big_Power-Board-ebook-photo/chapter_4-2/chapter_4-2_2.png" width="300" height="auto" />
### Software apps and online services
-  [Arduino IDE](https://www.hackster.io/arduino/products/arduino-ide?ref=project-958fd2)
<!--  -->
<!-- <img src="https://files.seeedstudio.com/wiki/XIAO_Big_Power-Board-ebook-photo//chapter_4-2/chapter_4-2_3.png" alt="verify-button.png" width="30" height="30" /> -->
-  [Edge Impulse Studio](https://www.hackster.io/EdgeImpulse/products/edge-impulse-studio?ref=project-958fd2)
<!--  -->
## 4.2.2 Introduction
As you learned in the previous section, microcontrollers (MCUs) are very cheap electronic components, usually with just a few kilobytes of RAM, designed to use tiny amounts of energy. They can be found in almost any consumer, medical, automotive, and industrial device. Over 40 billion microcontrollers will be sold this year, and there are probably hundreds of billions in service nowadays. However, these devices get little attention because they're often only used to replace the functionality of older electro-mechanical systems in cars, washing machines, or remote controls. More recently, with the Internet of Things (IoT) era, a significant part of those MCUs is generating "quintillions" of data that, in its majority, is not used due to the high cost and complexity (bandwidth and latency) of data transmission.
On the other hand, in recent decades, we have seen a lot of development in Machine Learning models trained with vast amounts of data in very powerful and power-hungry mainframes. And what is happening today is that due to those developments, it is now possible to take noisy signals like images, audio, or accelerometers and extract meaning from them by using Machine Learning algorithms such as Neural Networks.
And what is more important is that we can run these algorithms on microcontrollers and sensors themselves using very little power, interpreting much more of those sensor data that we are currently ignoring. This is TinyML, a new technology that enables machine intelligence right next to the physical world.
> TinyML can have many exciting applications for the benefit of society at large.
This section will explore TinyML, running on a robust and tiny device, the [Seed XIAO nRF52840 Sense](https://www.seeedstudio.com/Seeed-XIAO-BLE-Sense-nRF52840-p-5253.html)(also called XIAO BLE Sense).
## 4.2.3 XIAO nRF52840 Sense
<!-- 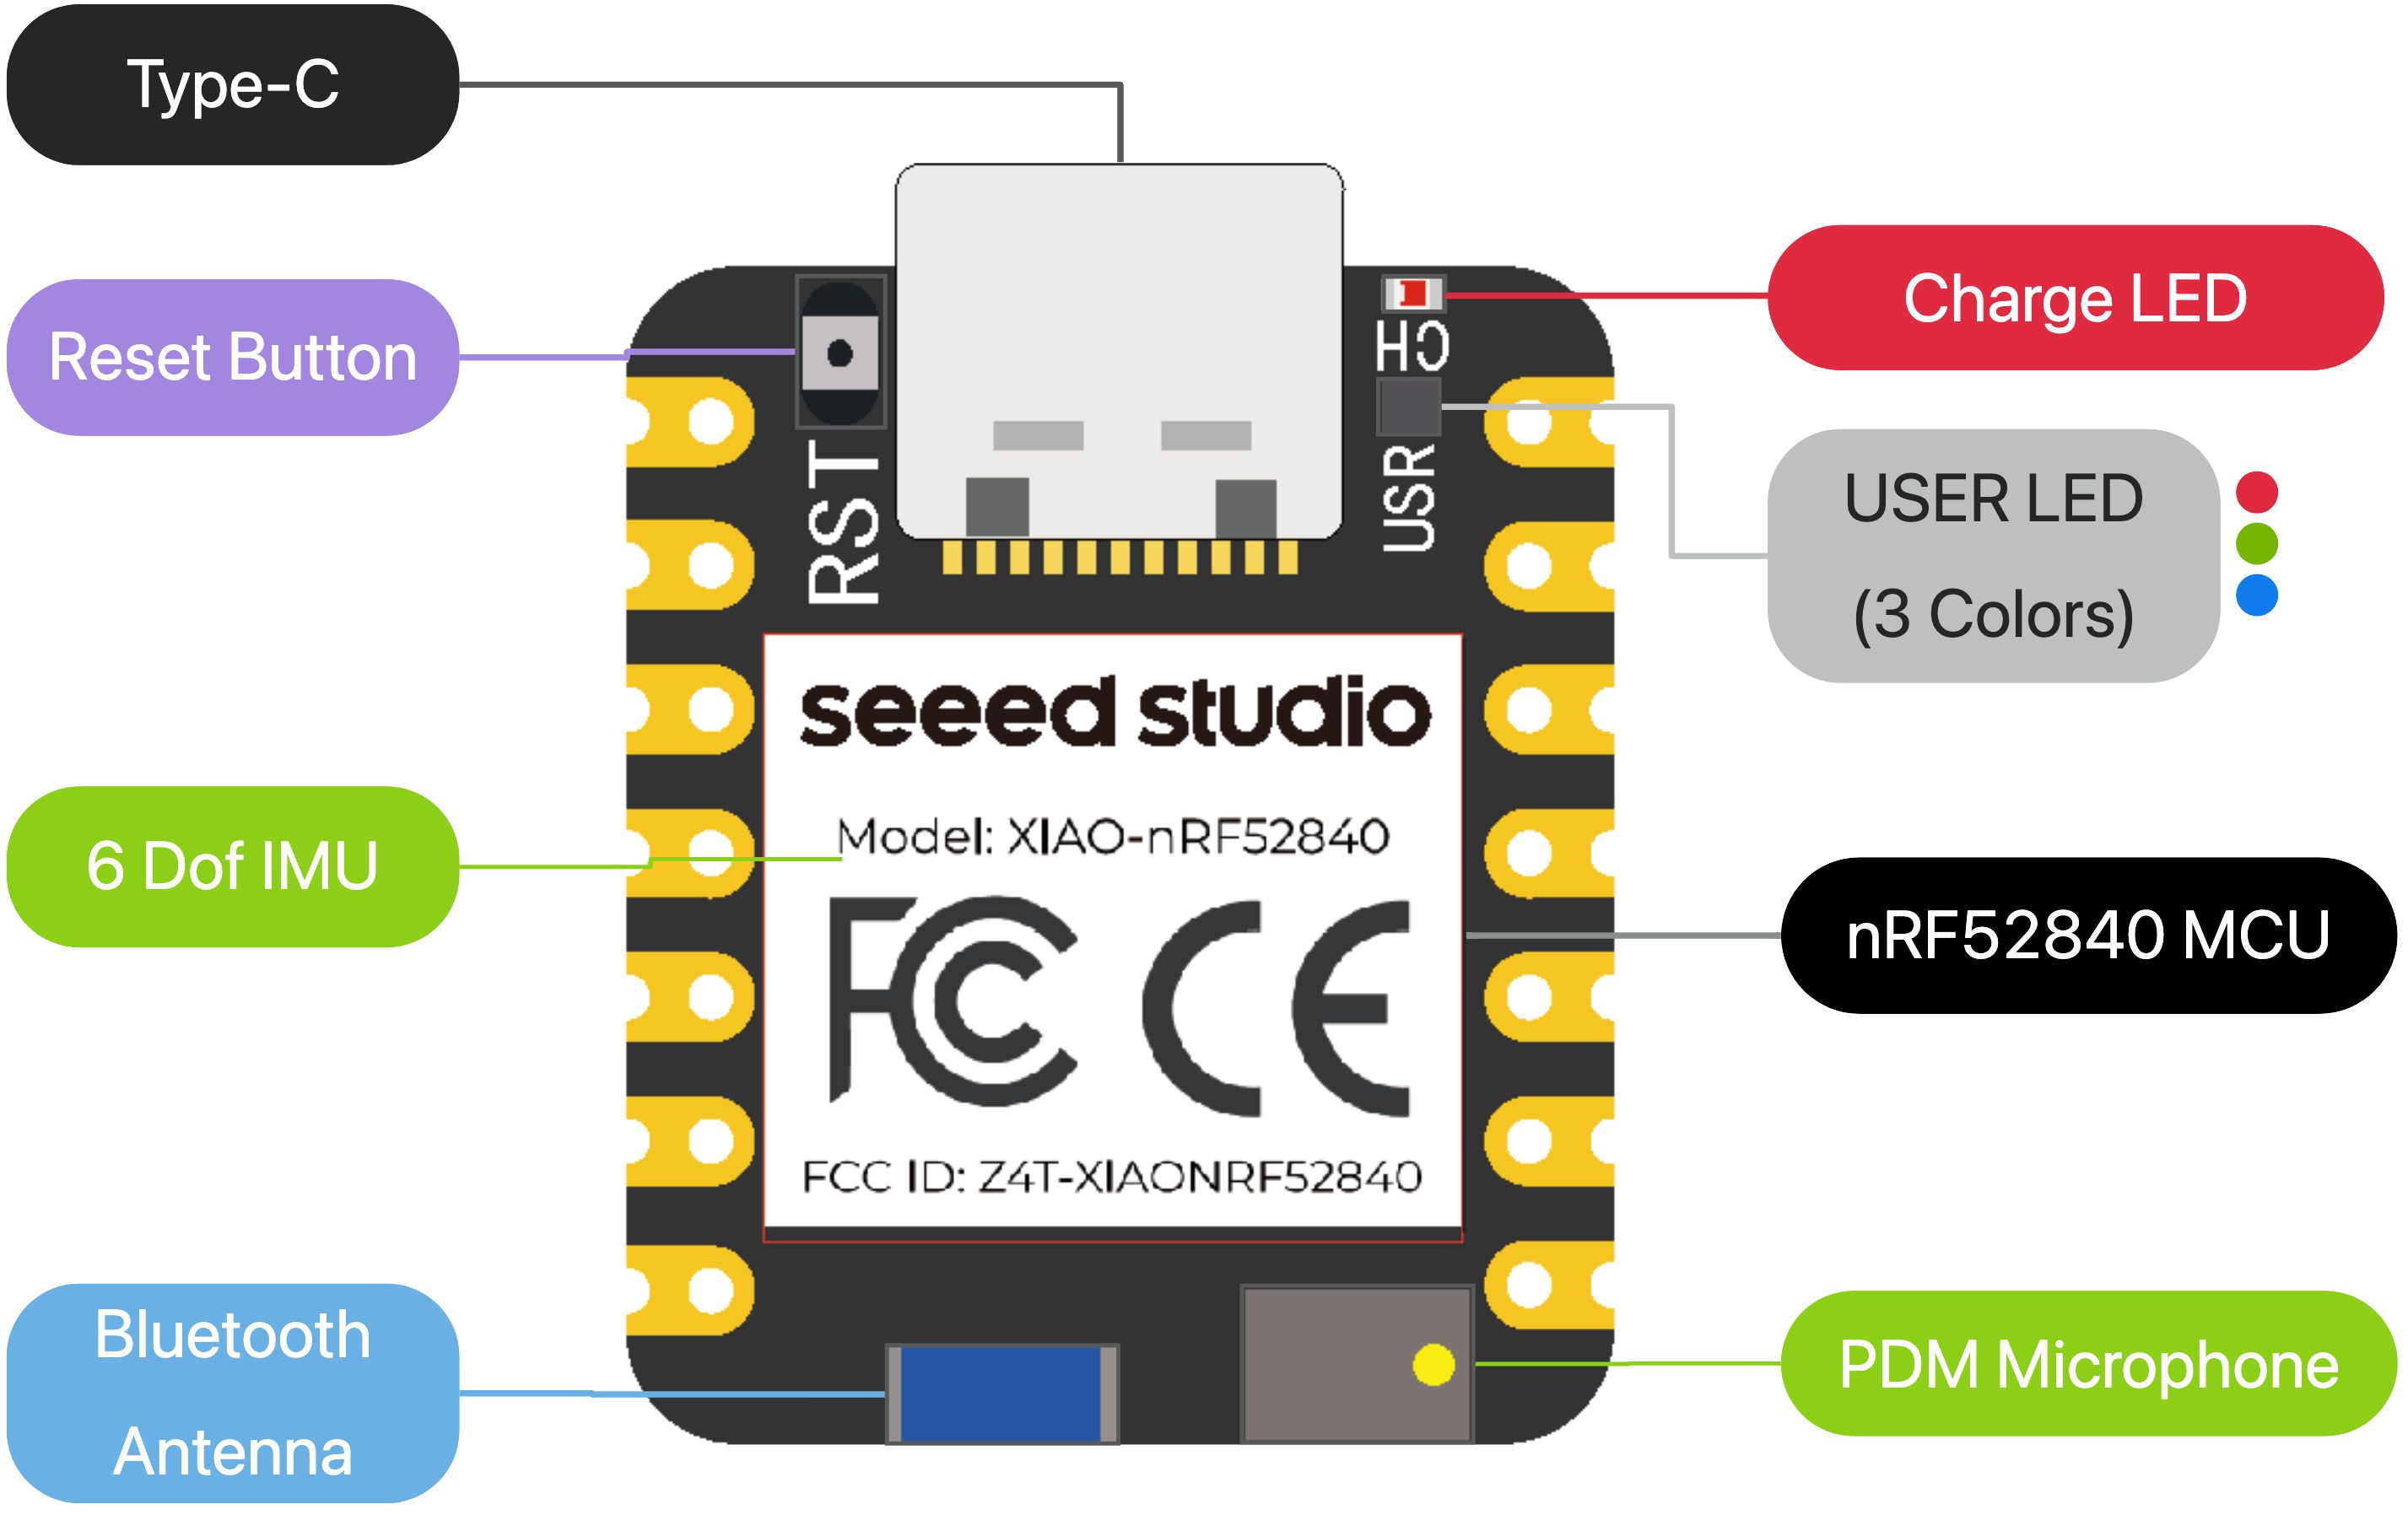 -->
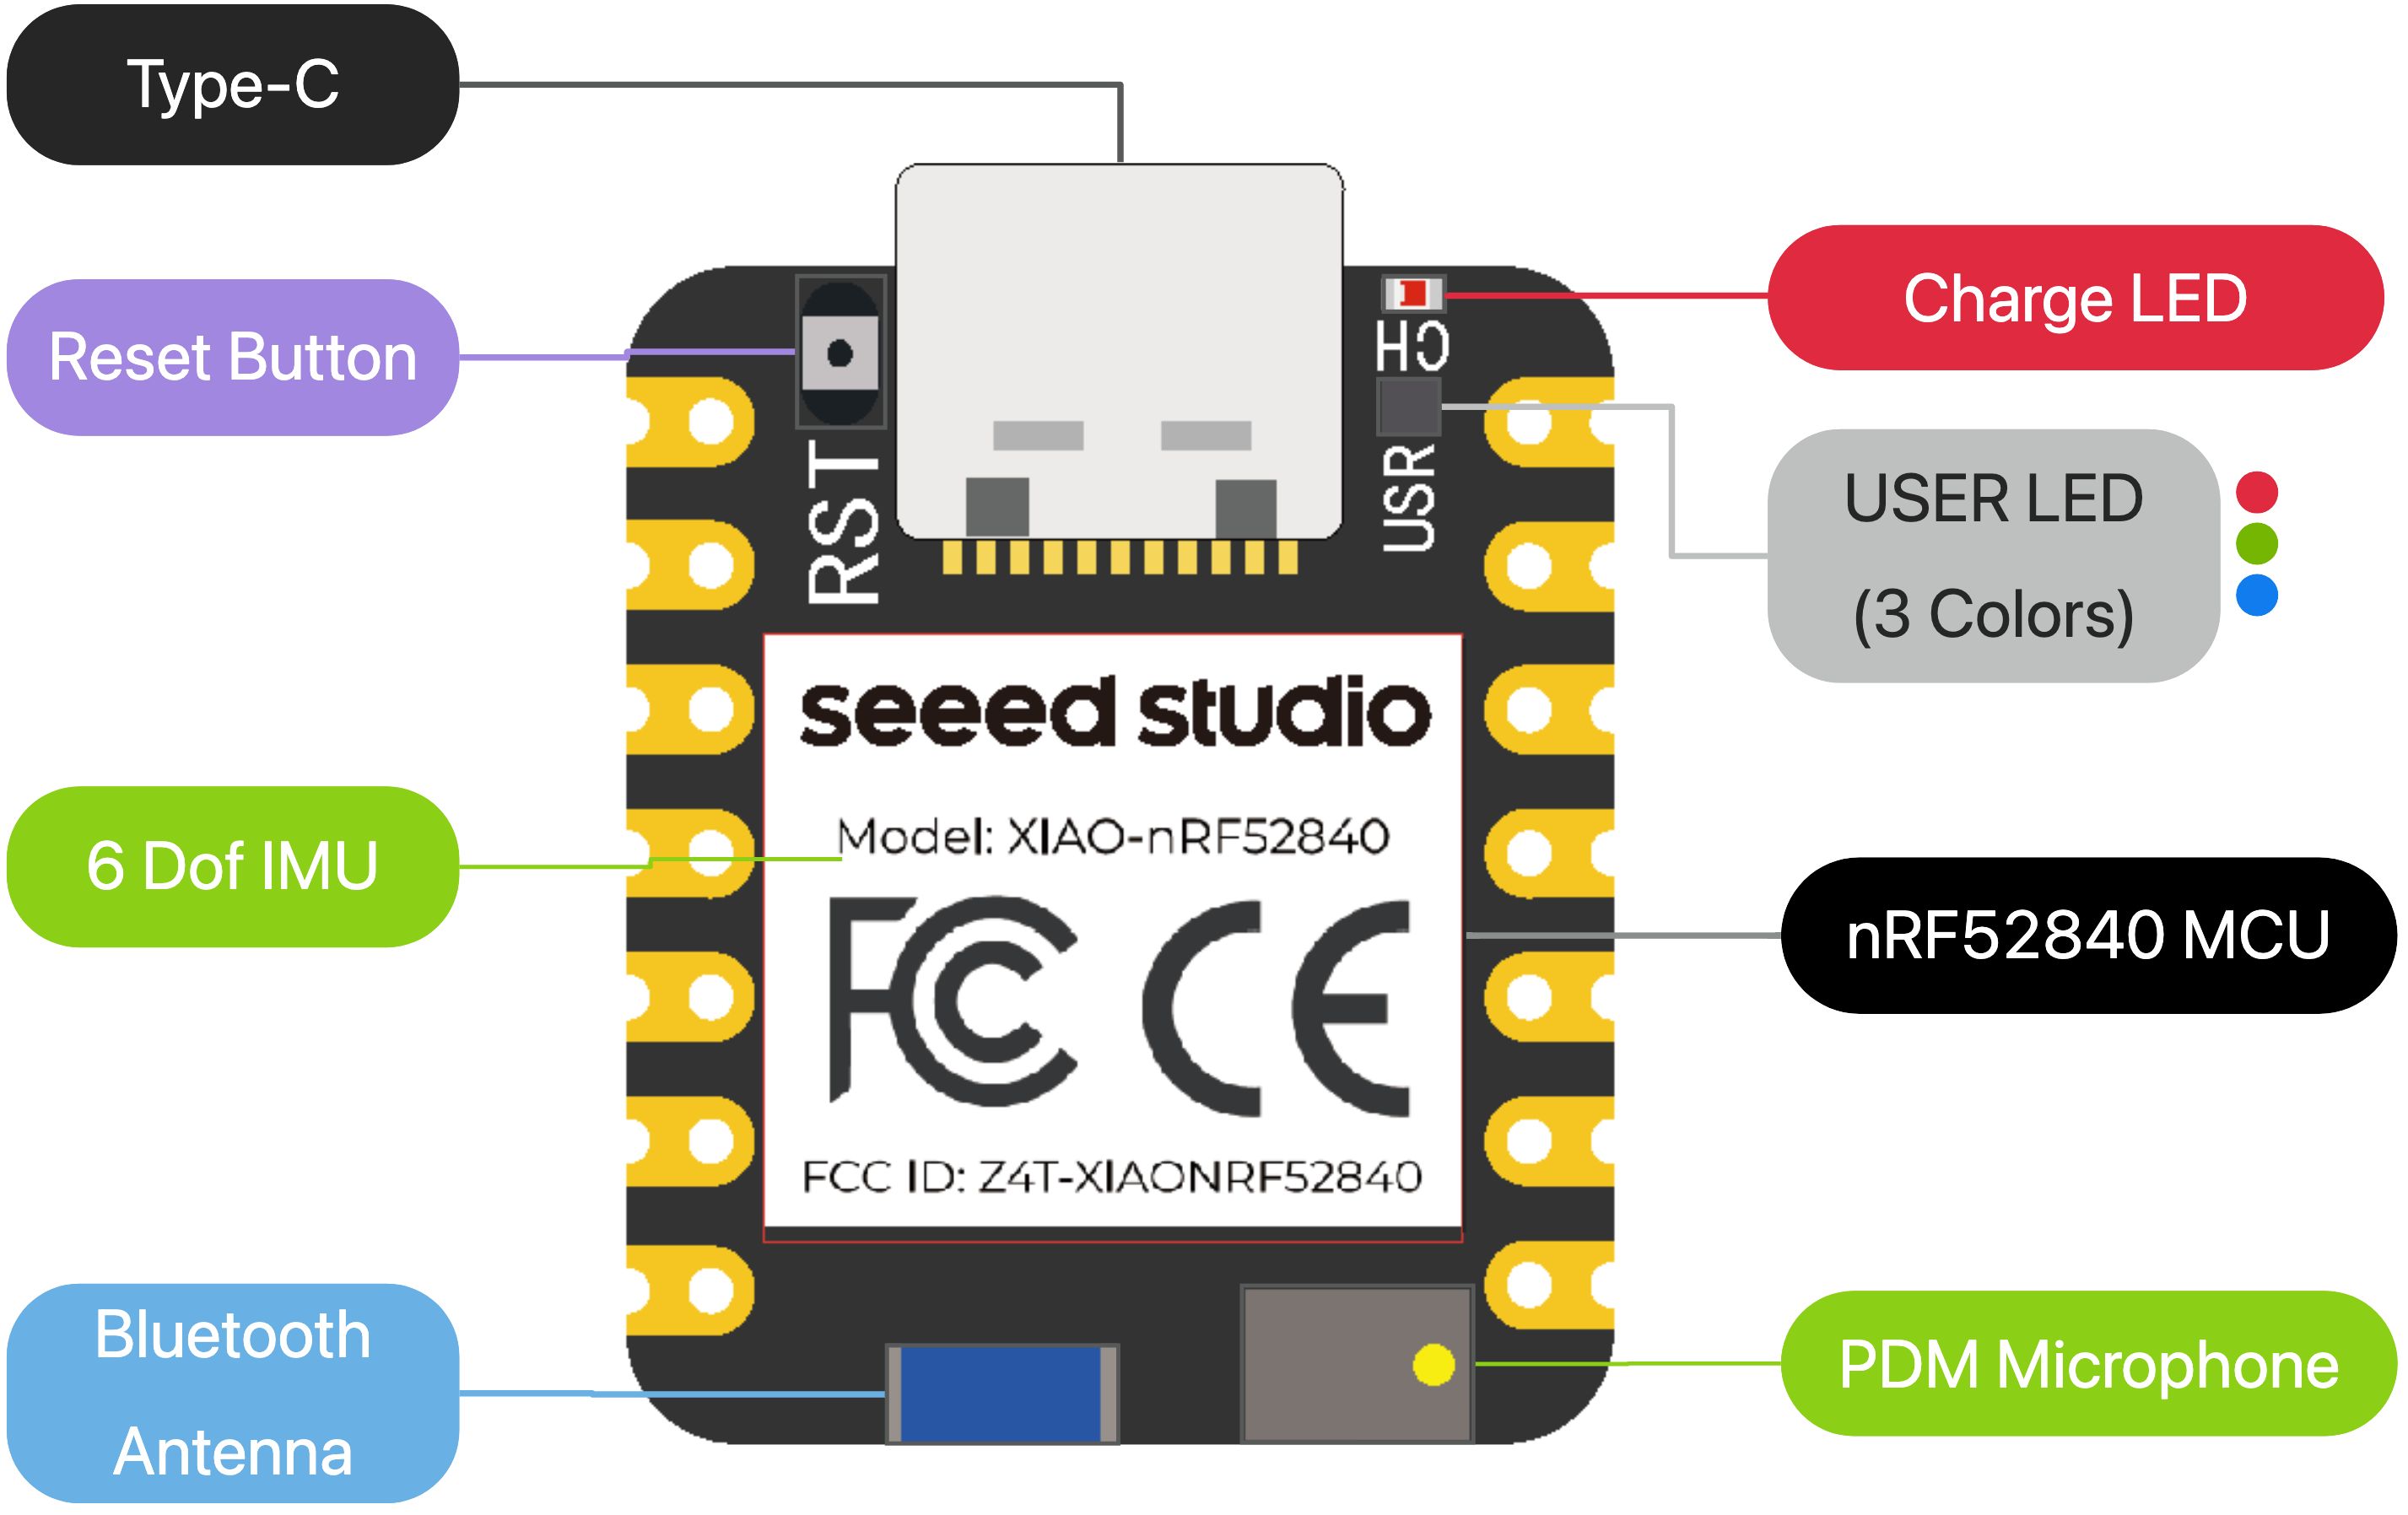
#### **MainFeatures**
- Bluetooth 5.0 with onboard antenna
- CPU: Nordic nRF52840, ARM® Cortex®-M4 32-bit processor with FPU, 64 MHz
- Ultra-Low Power: Standby power consumption is less than 5μA
- Battery charging chip: Supports lithium battery charge and discharge management
- 2 MB flash
- 256 KB RAM
- PDM microphone
- 6-axis LSM6DS3TR-C IMU
- Ultra Small Size: 20 x 17.5mm, XIAO series classic form-factor for wearable devices
- Rich interfaces: 1xUART, 1xI2C, 1xSPI, 1xNFC, 1xSWD, 11xGPIO(PWM), 6xADC
- Single-sided components, surface mounting design
### 4.2.3.1 Connecting the XIAO nRF52840 Sense with Arduino IDE
The simple way to test and use this device is using the [Arduino IDE](https://www.arduino.cc/en/software). Once you have the IDE installed on your machine, navigate to `File > Preferences`, and fill in "Additional Boards Manager URLs" with the URL below: `https://files.seeedstudio.com/arduino/package_seeeduino_boards_index.json`
<!-- 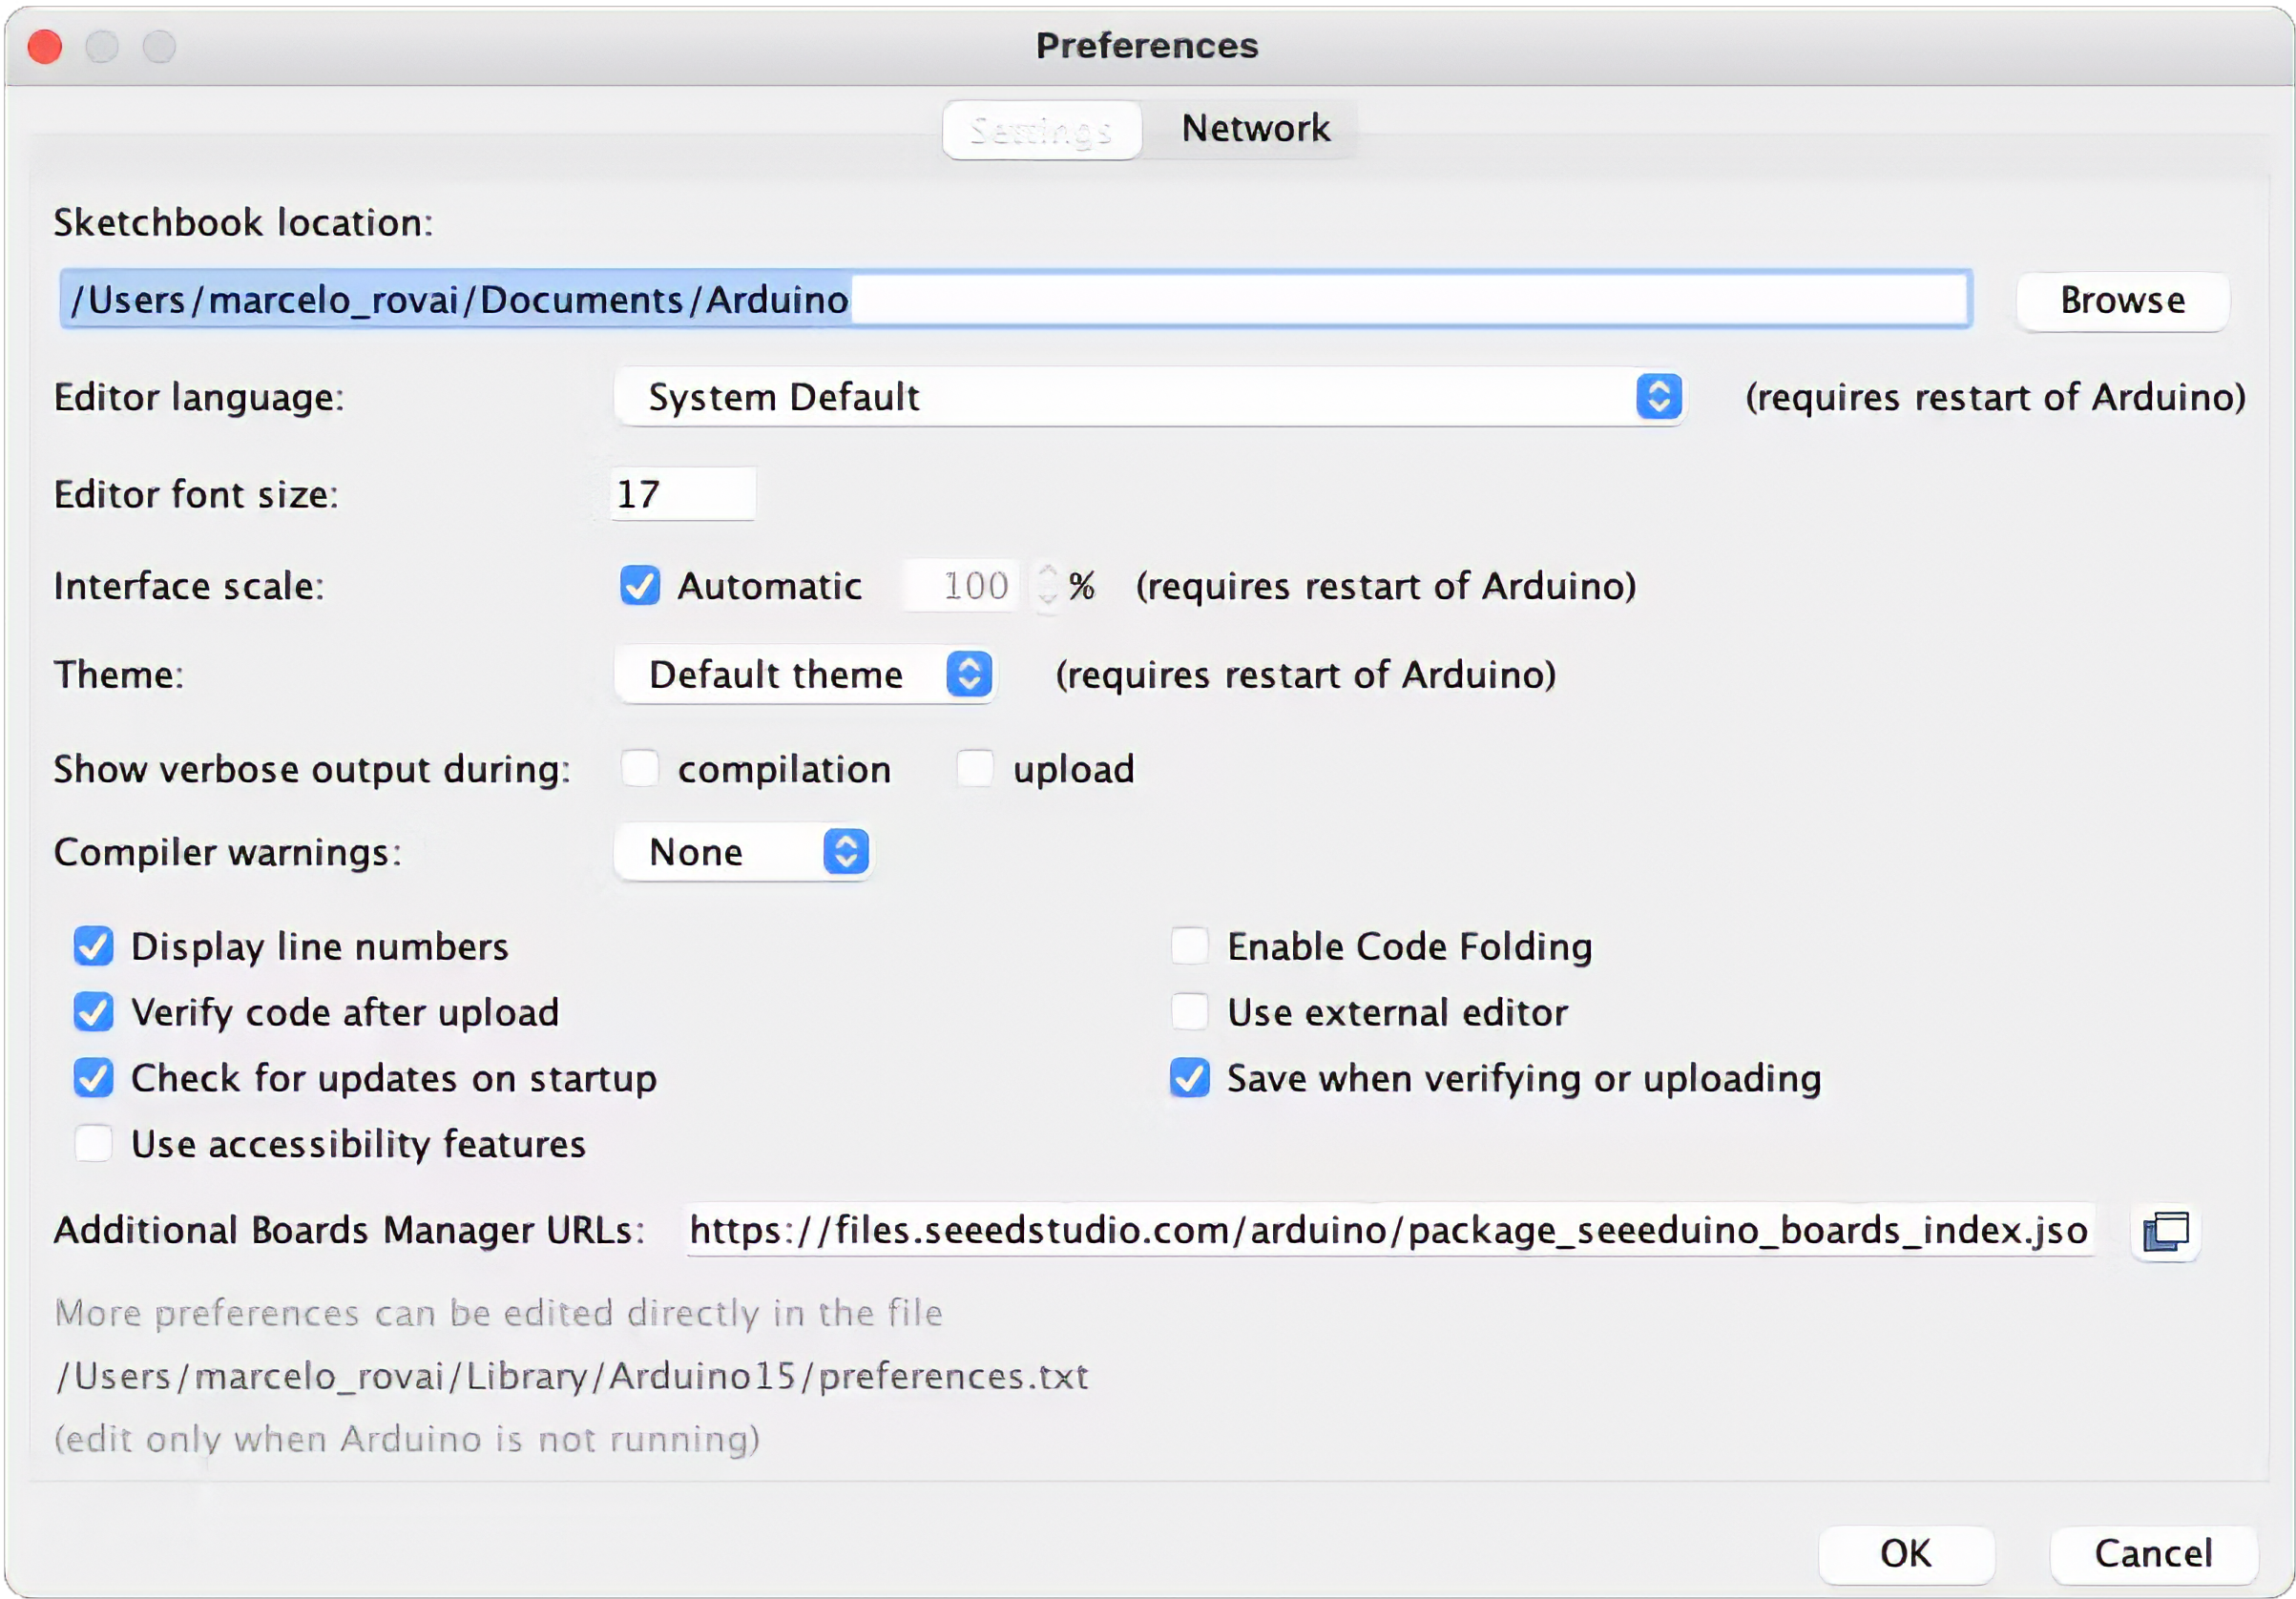 -->
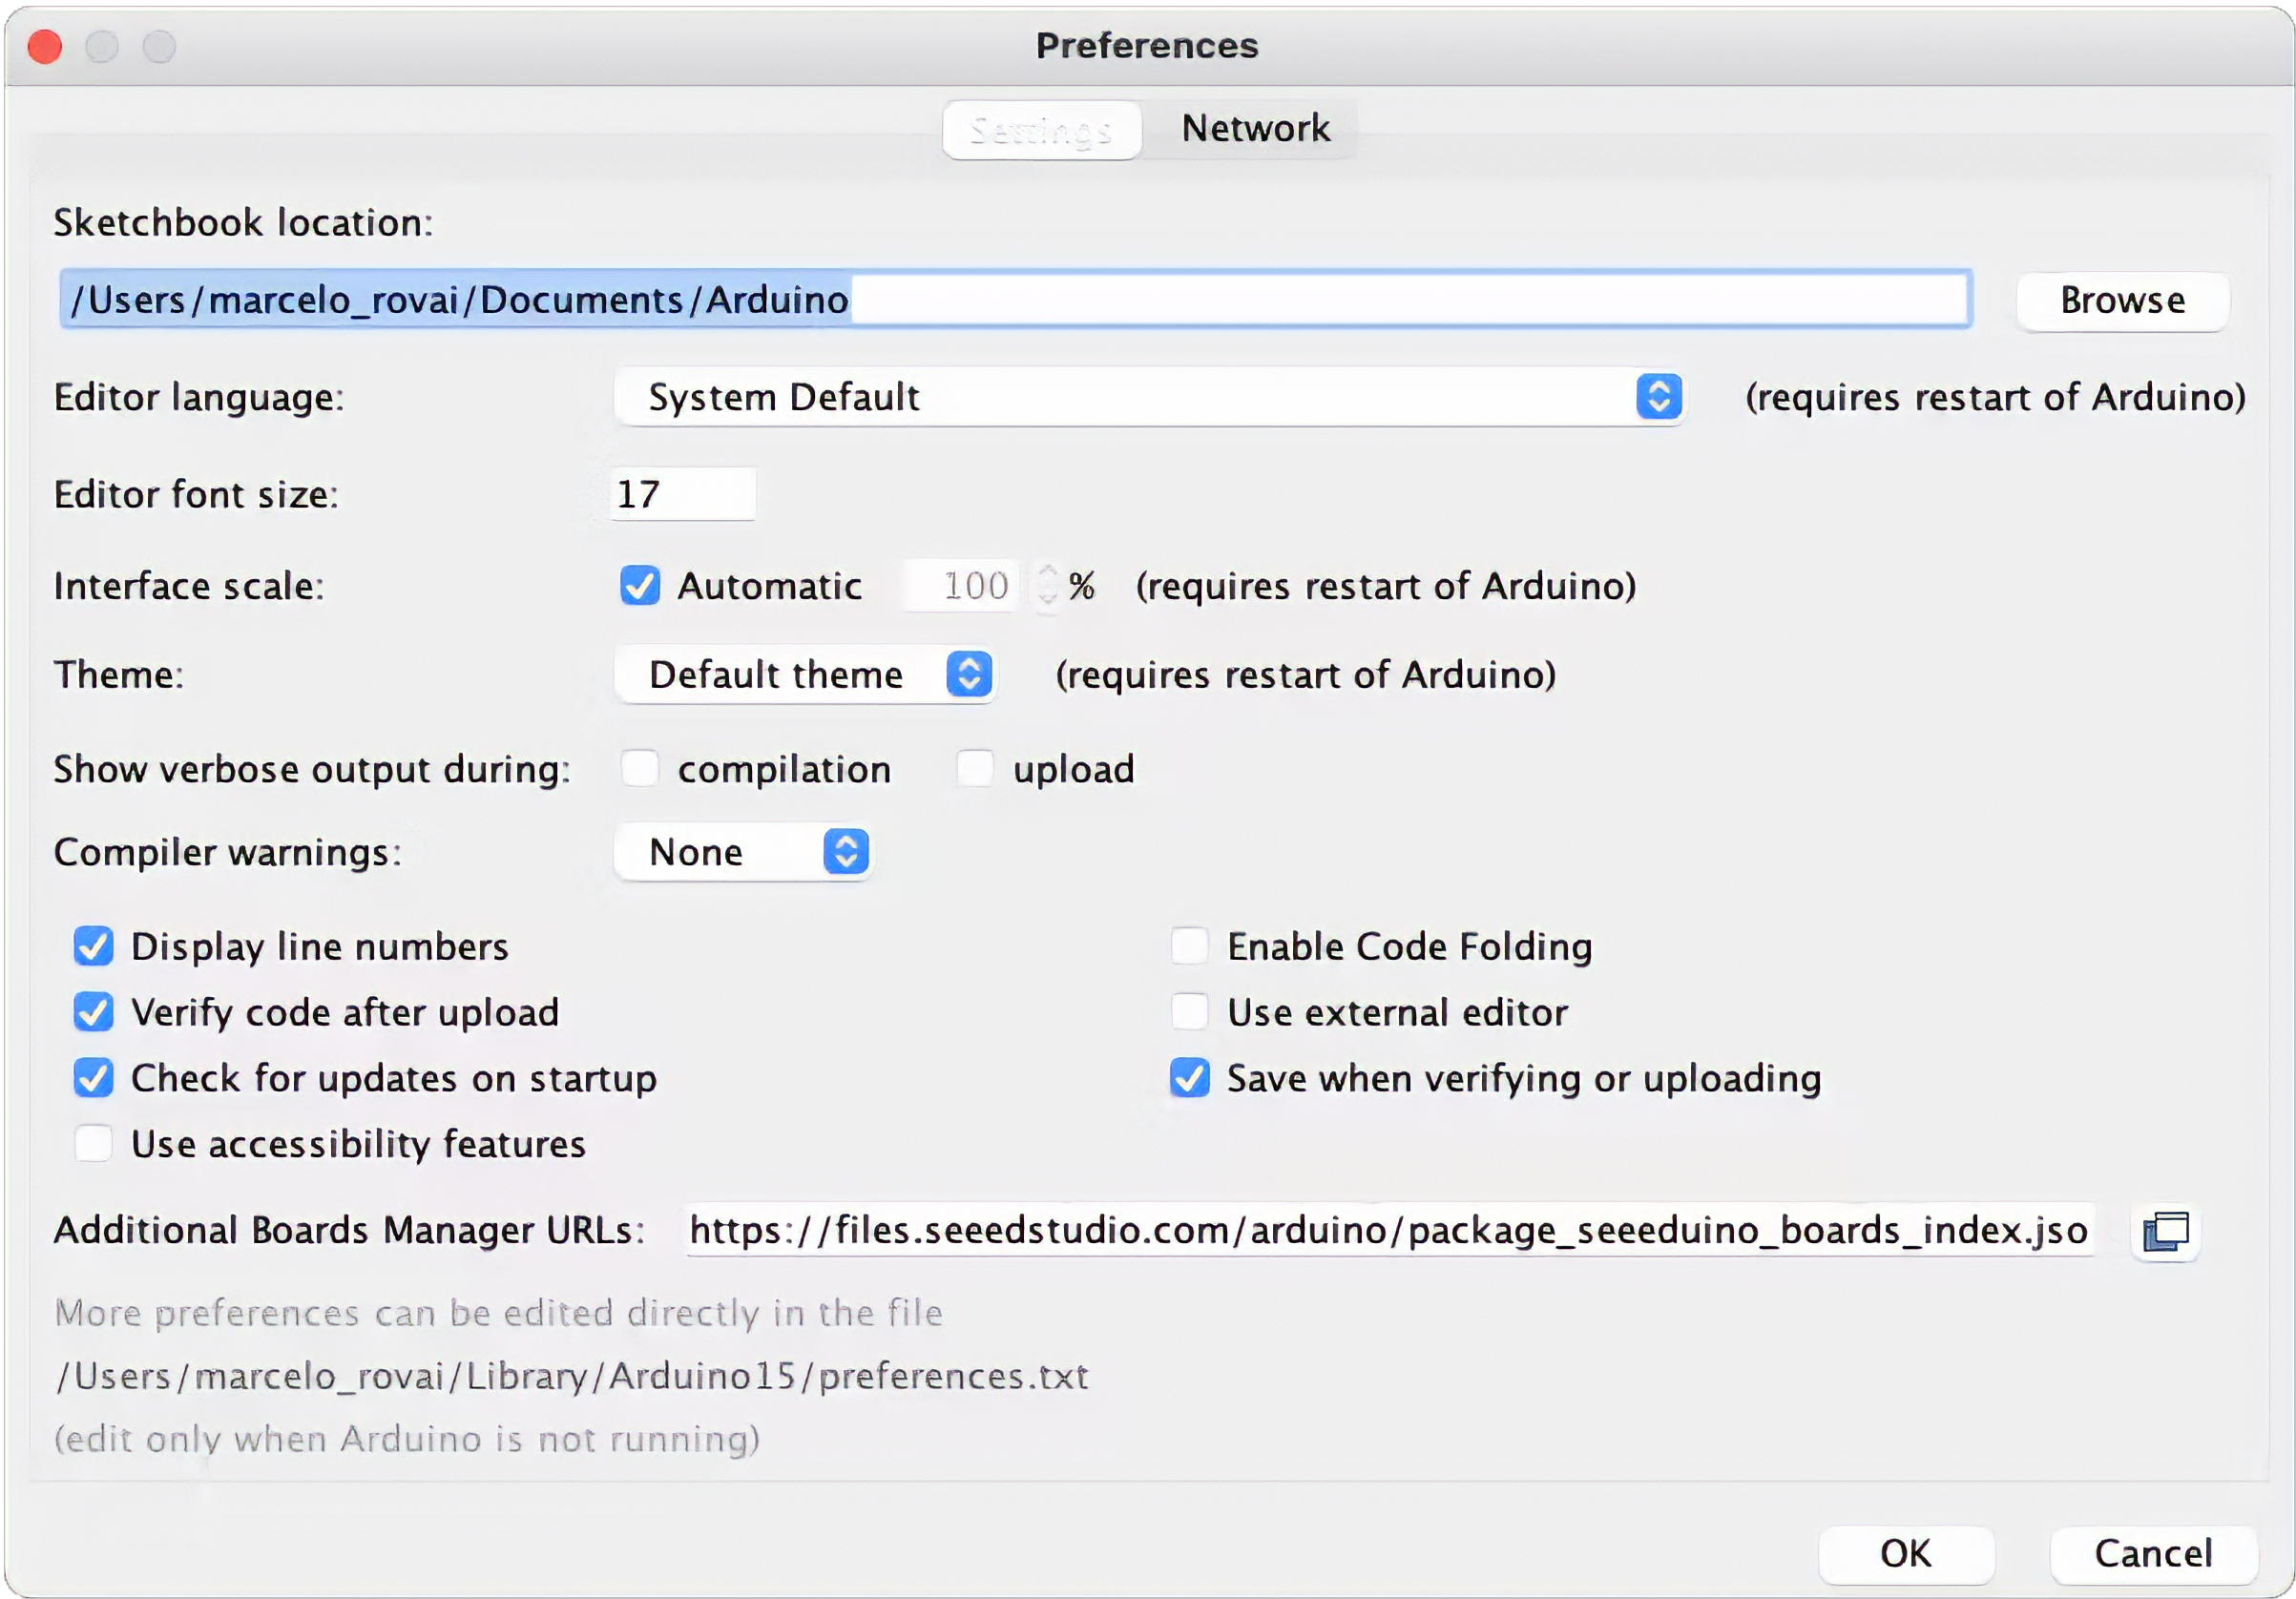
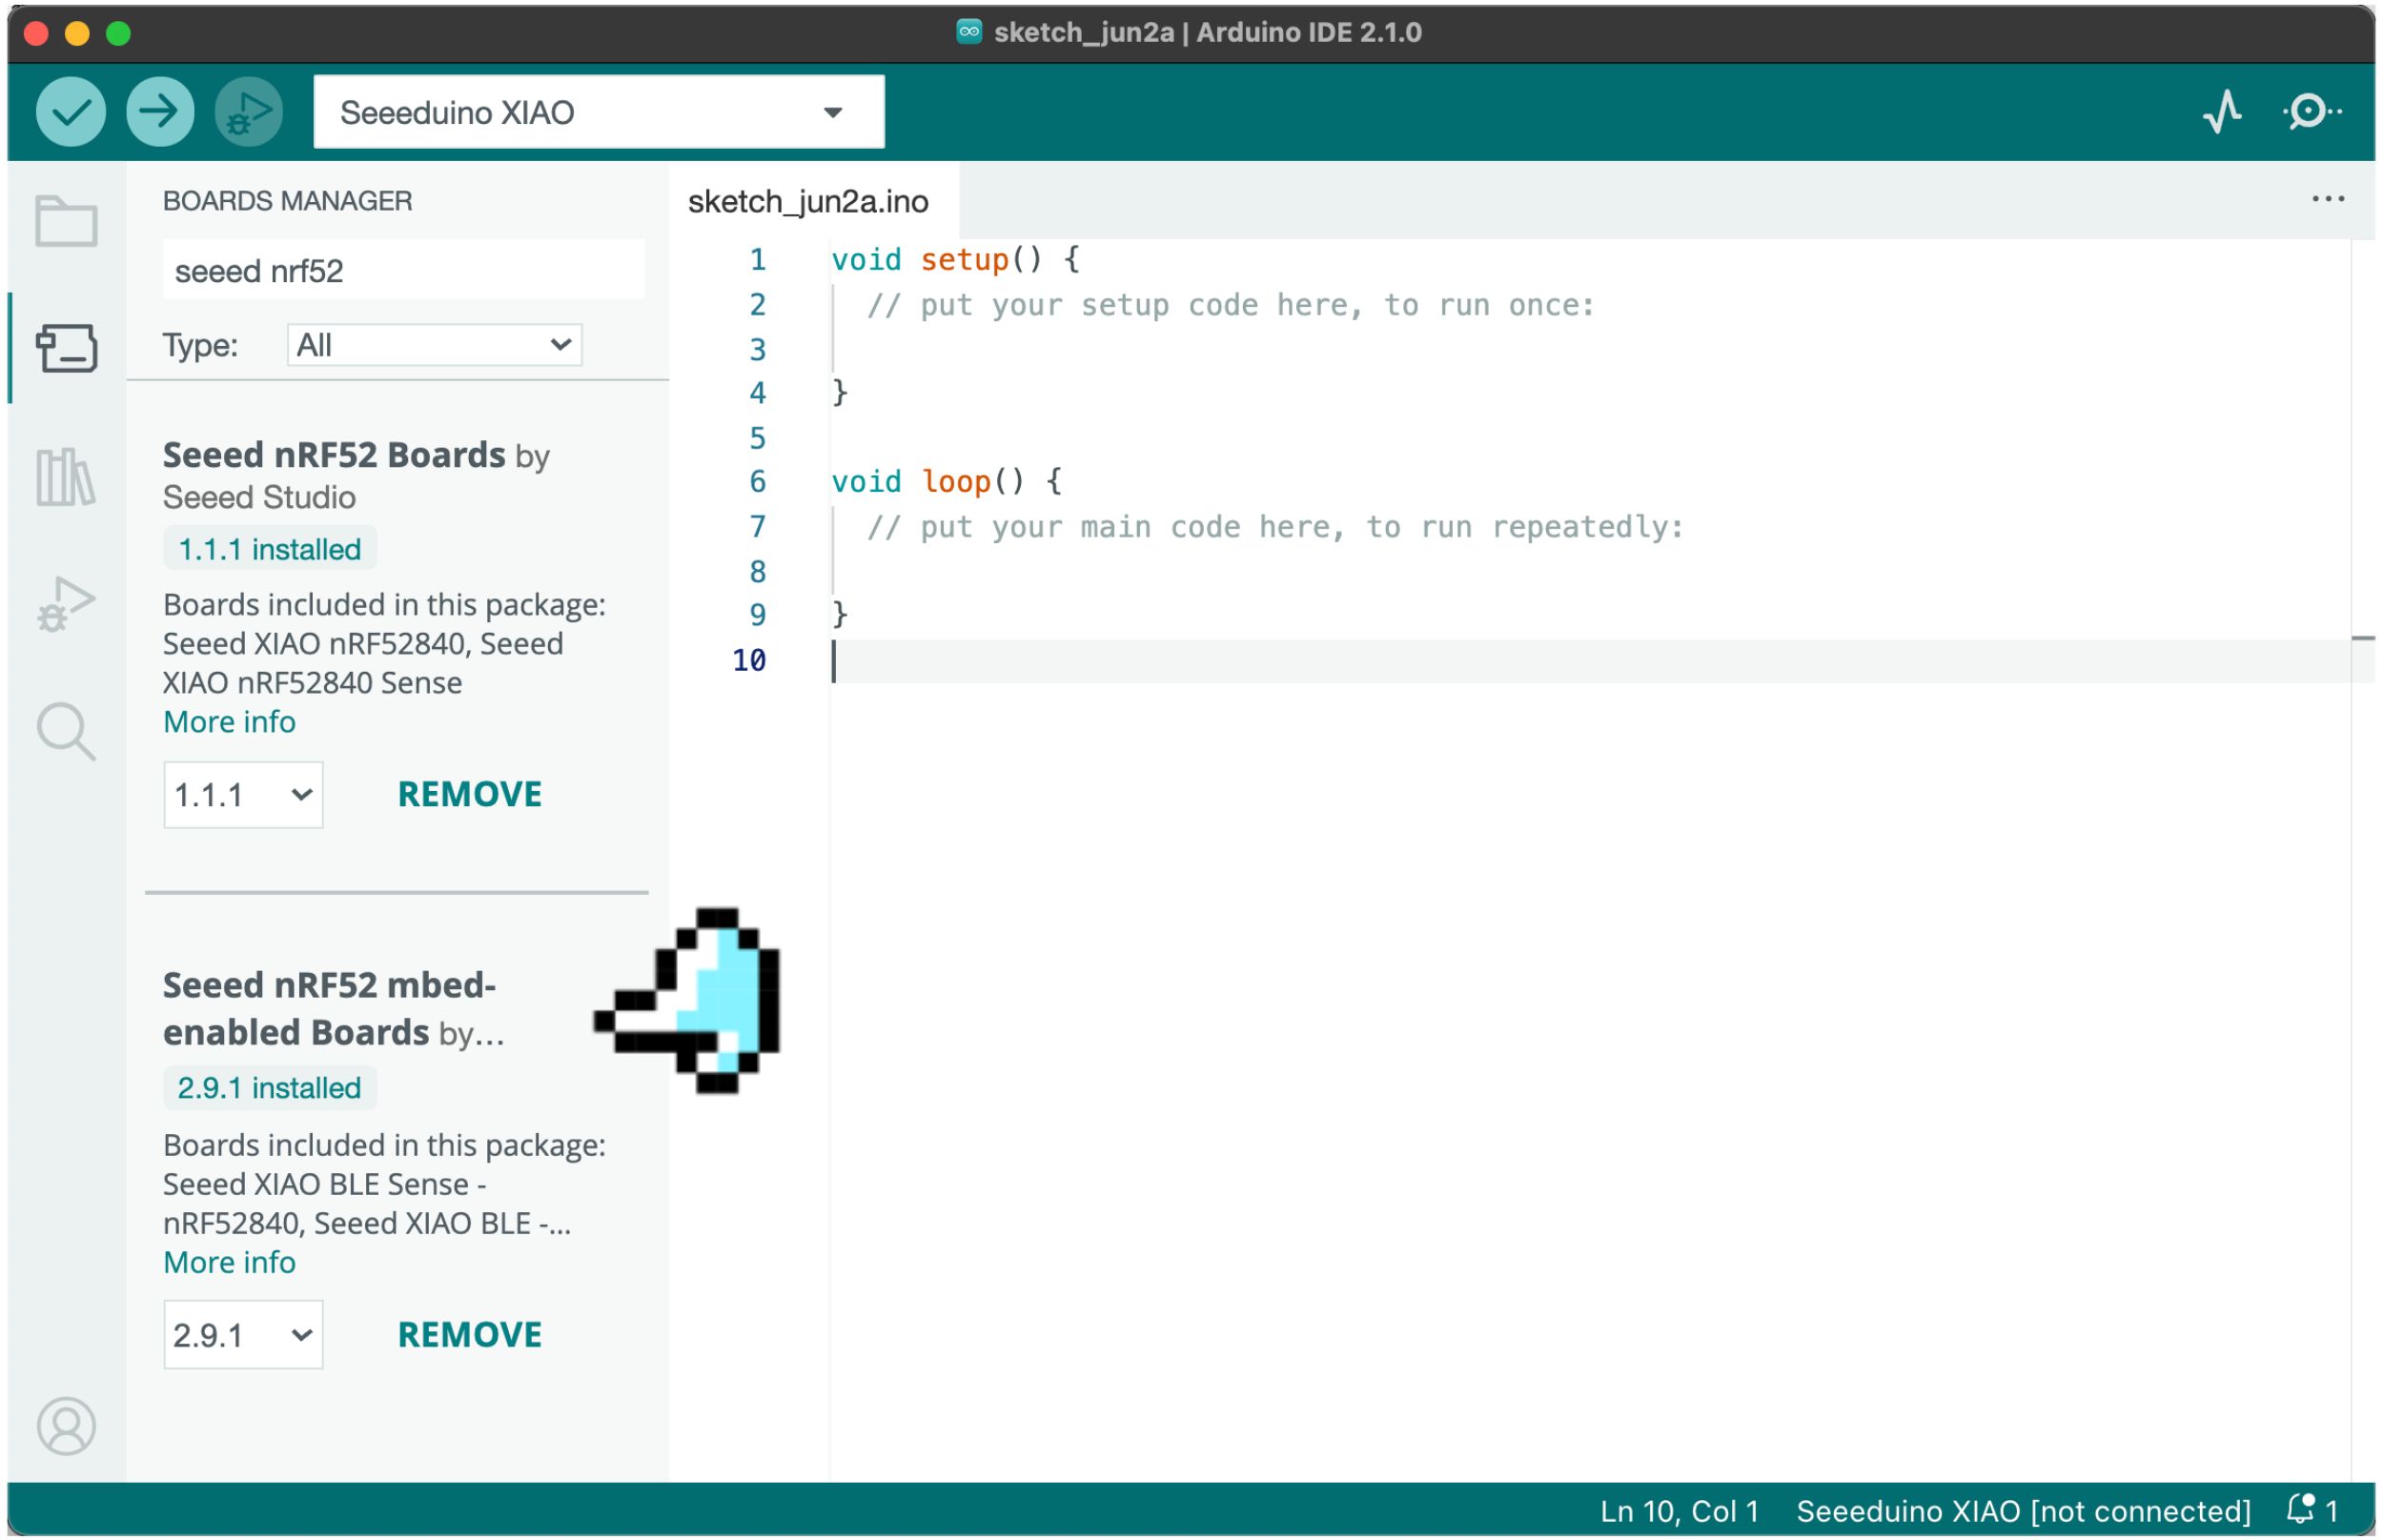
Now, navigate to `Tools→Board→Board Manager` in the top menu, and type in the filter keyword `seeed nrf52` in the search box.
You will see two installation packages: `Seeed nRF52 Boards` and `Seeed nRF52 mbed-enabled Boards`, the differences between these two packages are as follows:
- `Seeed nRF52 Boards`: Friendly for Bluetooth and low-power compatibility, suitable for Bluetooth and low power applications.
- `Seeed nRF52 mbed-enabled Boards`: Friendly for TinyML support, suitable for making TinyML or Bluetooth-related projects, but not suitable for applications with high low-power requirements.
Because we will develop a TinyML project, we chose the latest version of the `Seeed nRF52 mbed-enabled Boards` package. Install it and wait until you see a successful installation prompt in the output window.
<!--  -->
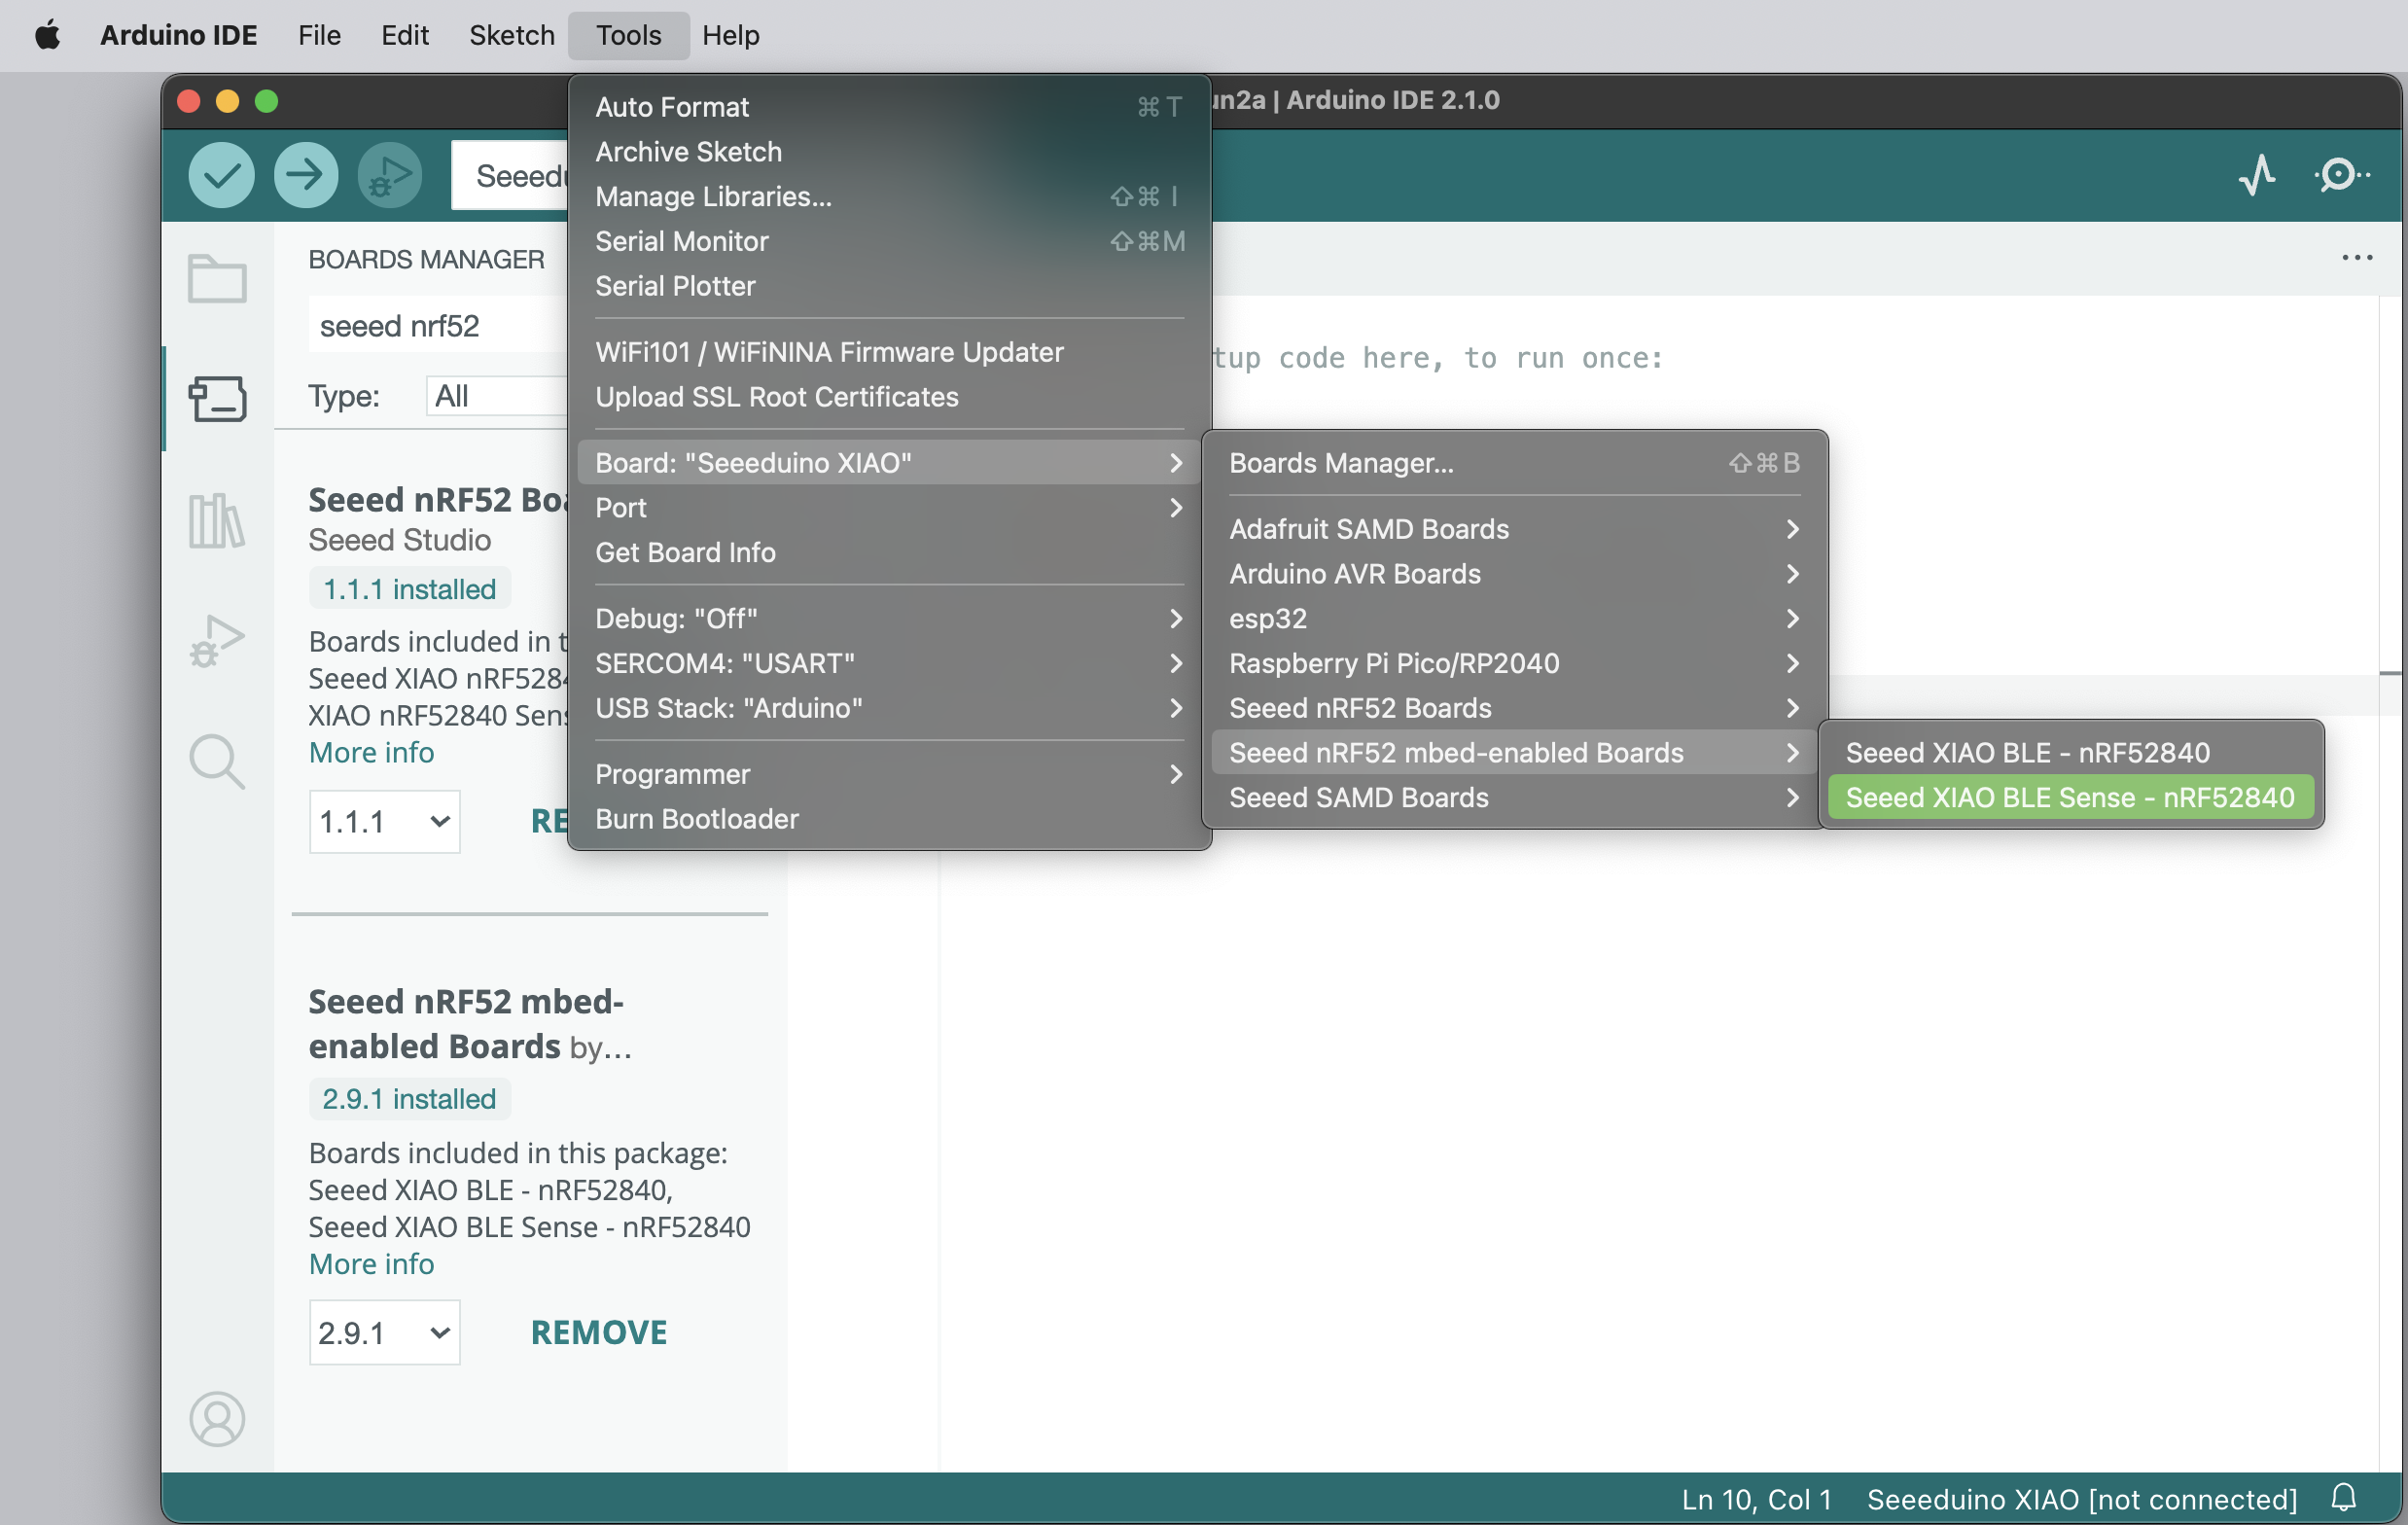
Now, you can access this device from your Arduino IDE by selecting the development board and serial port, as shown in the figure below.
<!--  -->
Your development board is now ready to run code on it. Let's start with Blink - lighting up the LED. Note that the board does not have a regular LED like most Arduino boards. Instead, you will find an RGB LED that can be activated with "reverse logic" (you should apply LOW to activate each of the three separate LEDs). Test your RGB LED with the following code:
``` cpp
void setup() {
// initialize serial.
Serial.begin(115200);
while (!Serial);
Serial.println("Serial Started");
// Pins for the built-in RGB LEDs on the Arduino Nano 33 BLE Sense
pinMode(LEDR, OUTPUT);
pinMode(LEDG, OUTPUT);
pinMode(LEDB, OUTPUT);
// Note: The RGB LEDs are ON when the pin is LOW and off when HIGH.
digitalWrite(LEDR, HIGH);
digitalWrite(LEDG, HIGH);
digitalWrite(LEDB, HIGH);
}
void loop() {
digitalWrite(LEDR, LOW);
Serial.println("LED RED ON");
delay(1000);
digitalWrite(LEDR, HIGH);
Serial.println("LED RED OFF");
delay(1000);
digitalWrite(LEDG, LOW);
Serial.println("LED GREEN ON");
delay(1000);
digitalWrite(LEDG, HIGH);
Serial.println("LED GREEN OFF");
delay(1000);
digitalWrite(LEDB, LOW);
Serial.println("LED BLUE ON");
delay(1000);
digitalWrite(LEDB, HIGH);
Serial.println("LED BLUE OFF");
delay(1000);
}
```
> Get this code online 🔗 <br />
> <https://github.com/Mjrovai/Seeed-XIAO-BLE-Sense/tree/main/Seeed_Xiao_Sense_bilnk_RGB>
Here is the result:
<!-- 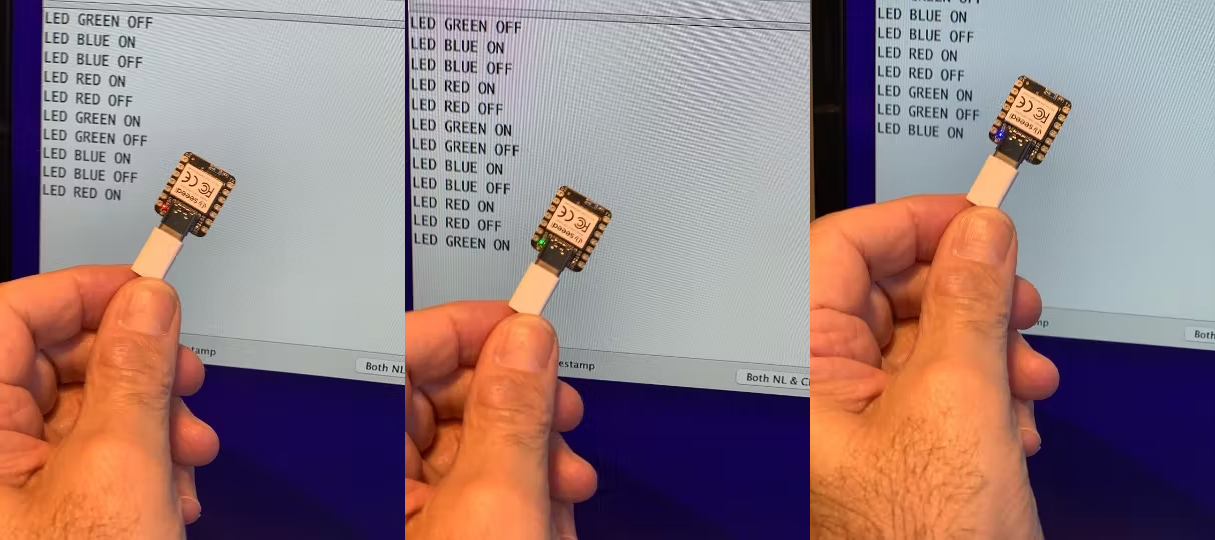 -->
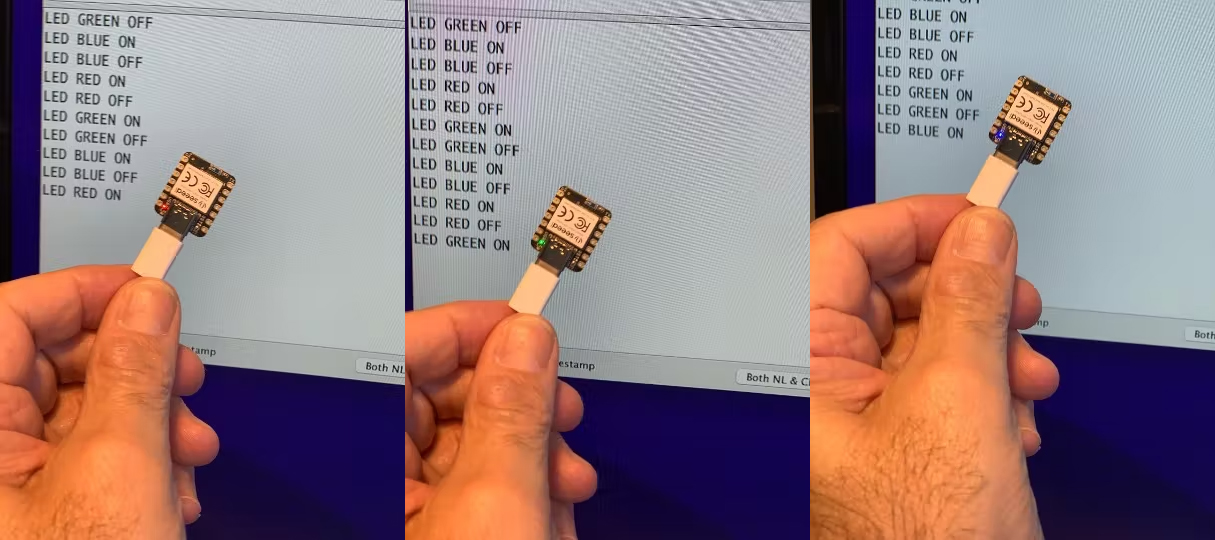
### 4.2.3.2 Testing the Microphone
The XIAO nRF52840 Sense has a [PDM digital output MEMS microphone](https://files.seeedstudio.com/wiki/XIAO-BLE/mic-MSM261D3526H1CPM-ENG.pdf). Run the below code for testing it:
``` cpp
#include <PDM.h>
// buffer to read samples into, each sample is 16-bits
short sampleBuffer[256];
// number of samples read
volatile int samplesRead;
void setup() {
Serial.begin(9600);
while (!Serial);
// configure the data receive callback
PDM.onReceive(onPDMdata);
// optionally set the gain, defaults to 20
// PDM.setGain(30);
// initialize PDM with:
// - one channel (mono mode)
// - a 16 kHz sample rate
if (!PDM.begin(1, 16000)) {
Serial.println("Failed to start PDM!");
while (1);
}
}
void loop() {
// wait for samples to be read
if (samplesRead) {
// print samples to the serial monitor or plotter
for (int i = 0; i < samplesRead; i++) {
Serial.println(sampleBuffer[i]);
// check if the sound value is higher than 500
if (sampleBuffer[i]>=500){
digitalWrite(LEDR,LOW);
digitalWrite(LEDG,HIGH);
digitalWrite(LEDB,HIGH);
}
// check if the sound value is higher than 250 and lower than 500
if (sampleBuffer[i]>=250 && sampleBuffer[i] < 500){
digitalWrite(LEDB,LOW);
digitalWrite(LEDR,HIGH);
digitalWrite(LEDG,HIGH);
}
//check if the sound value is higher than 0 and lower than 250
if (sampleBuffer[i]>=0 && sampleBuffer[i] < 250){
digitalWrite(LEDG,LOW);
digitalWrite(LEDR,HIGH);
digitalWrite(LEDB,HIGH);
}
}
// clear the read count
samplesRead = 0;
}
}
void onPDMdata() {
// query the number of bytes available
int bytesAvailable = PDM.available();
// read into the sample buffer
PDM.read(sampleBuffer, bytesAvailable);
// 16-bit, 2 bytes per sample
samplesRead = bytesAvailable / 2;
}
```
The above code will continuously capture data to its buffer, displaying it in the Serial Monitor and Plotter:
<!-- 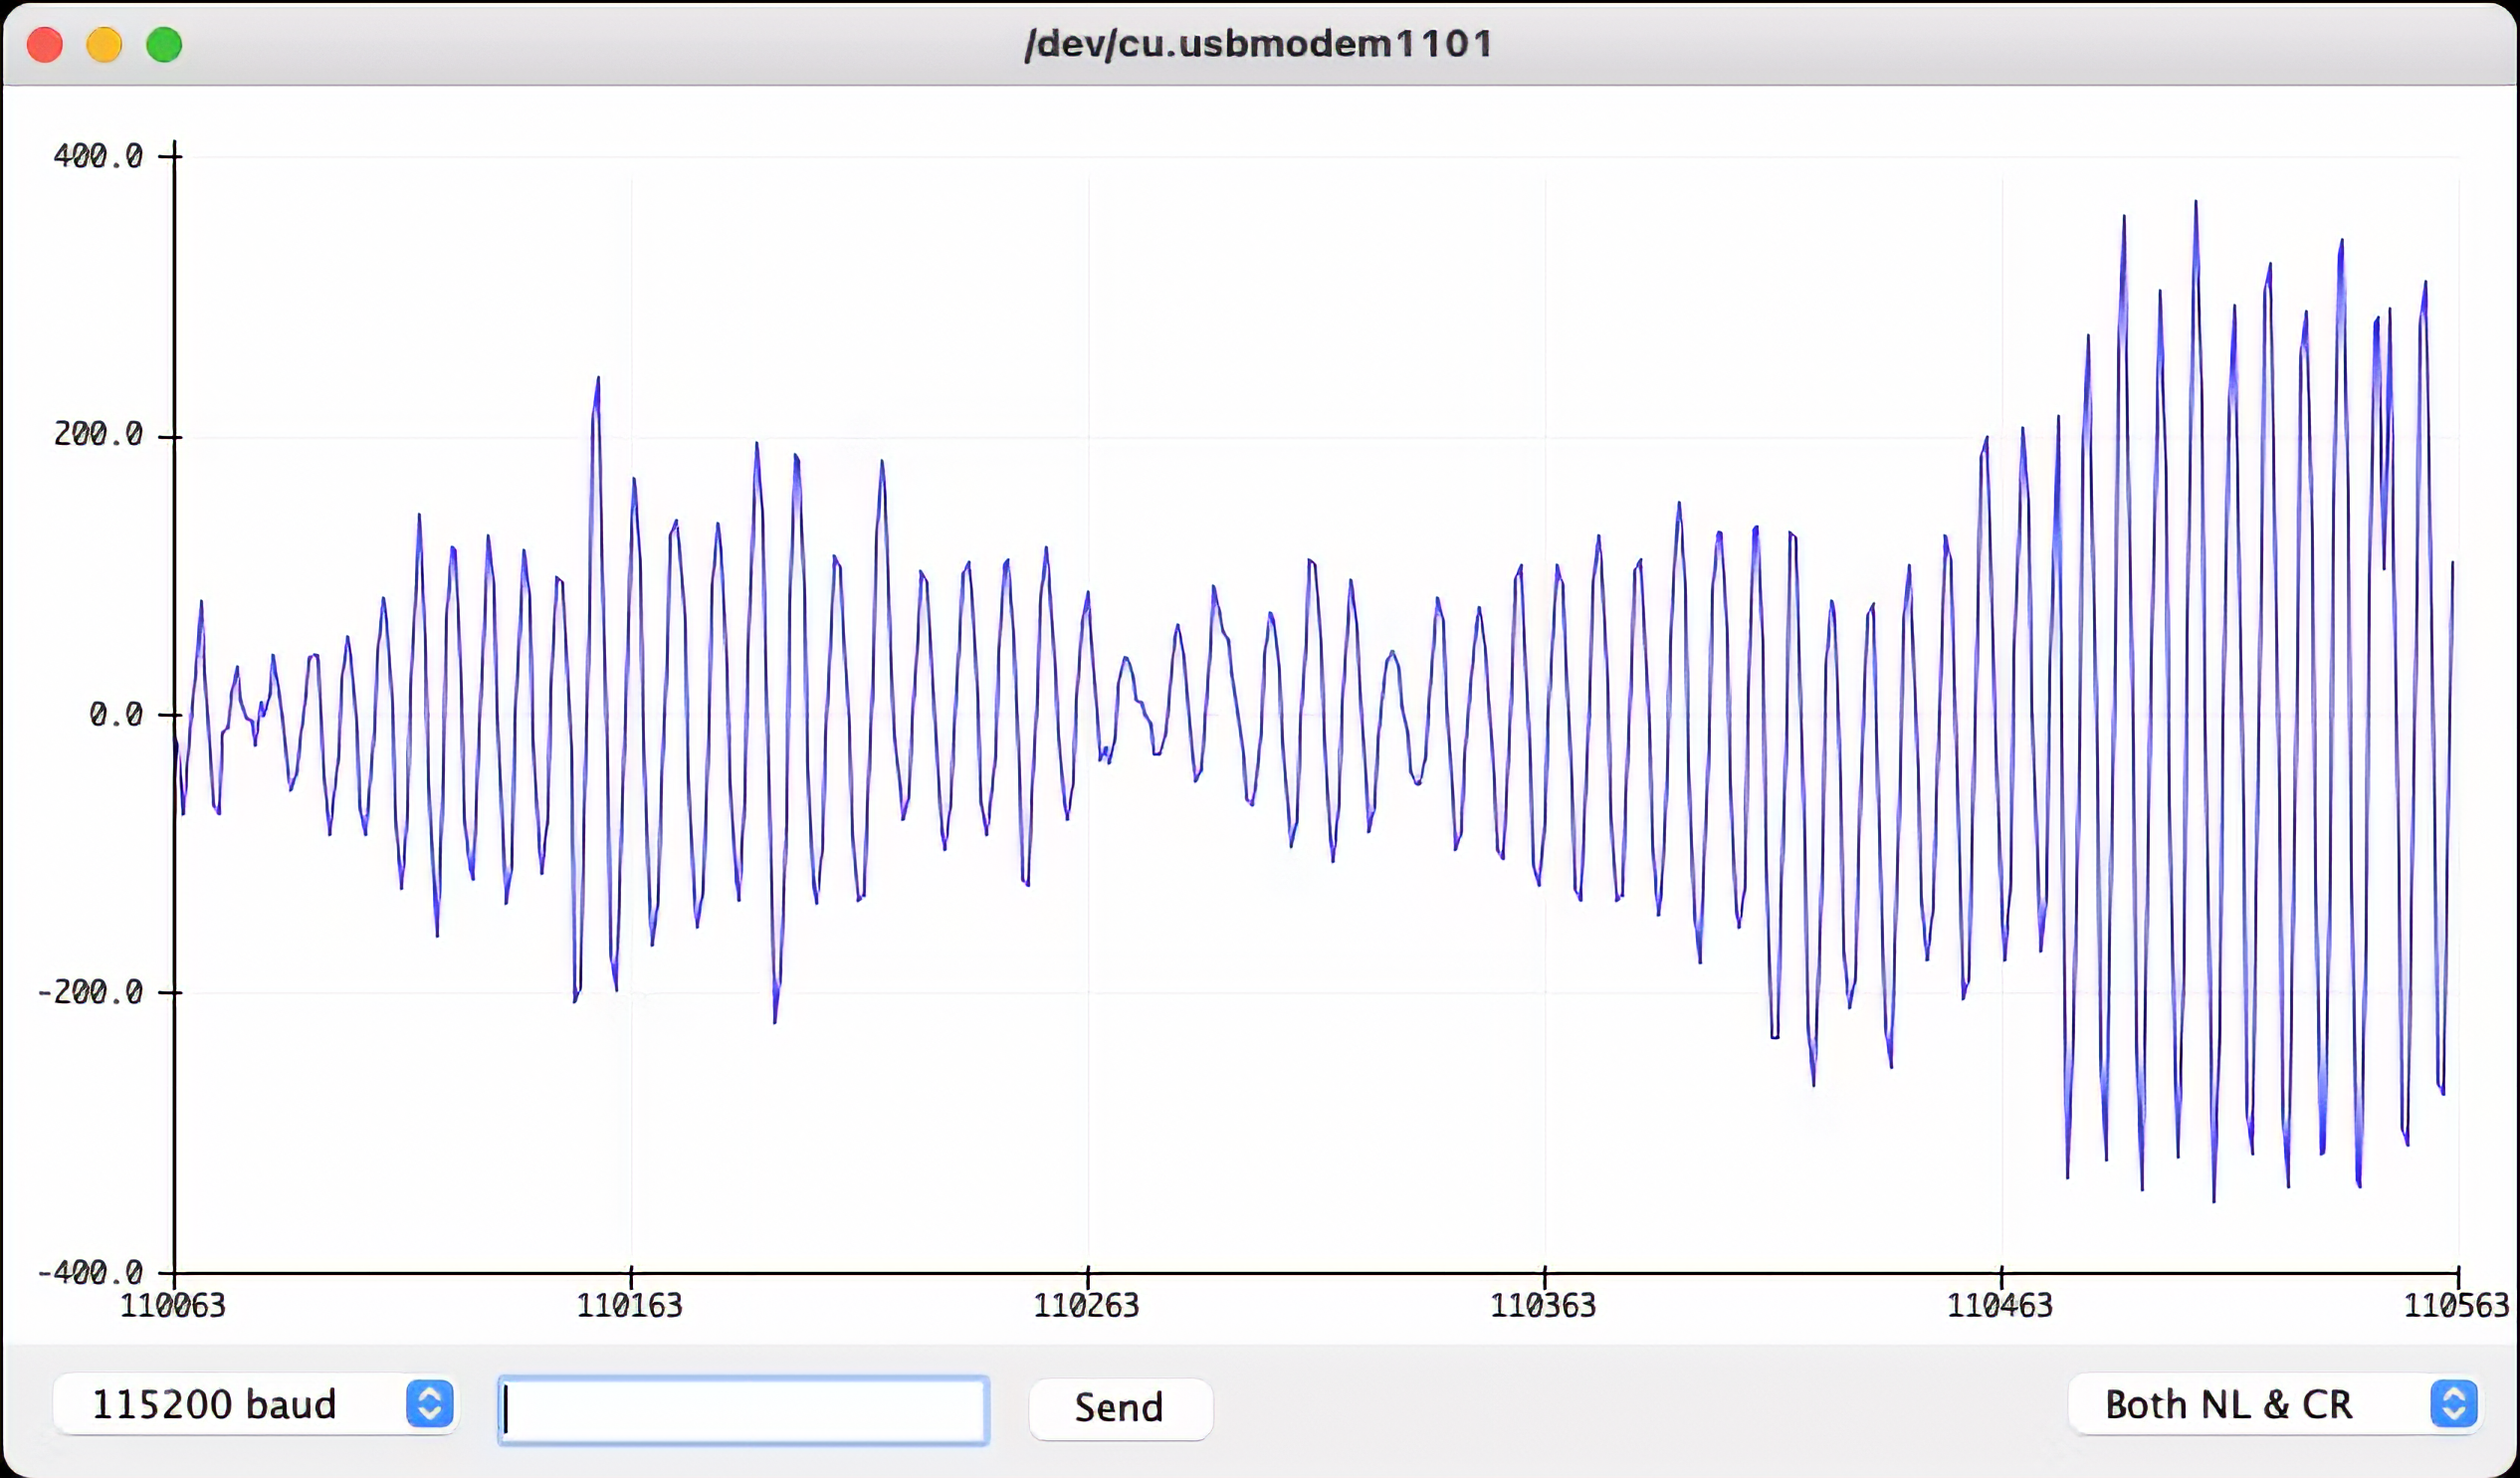 -->
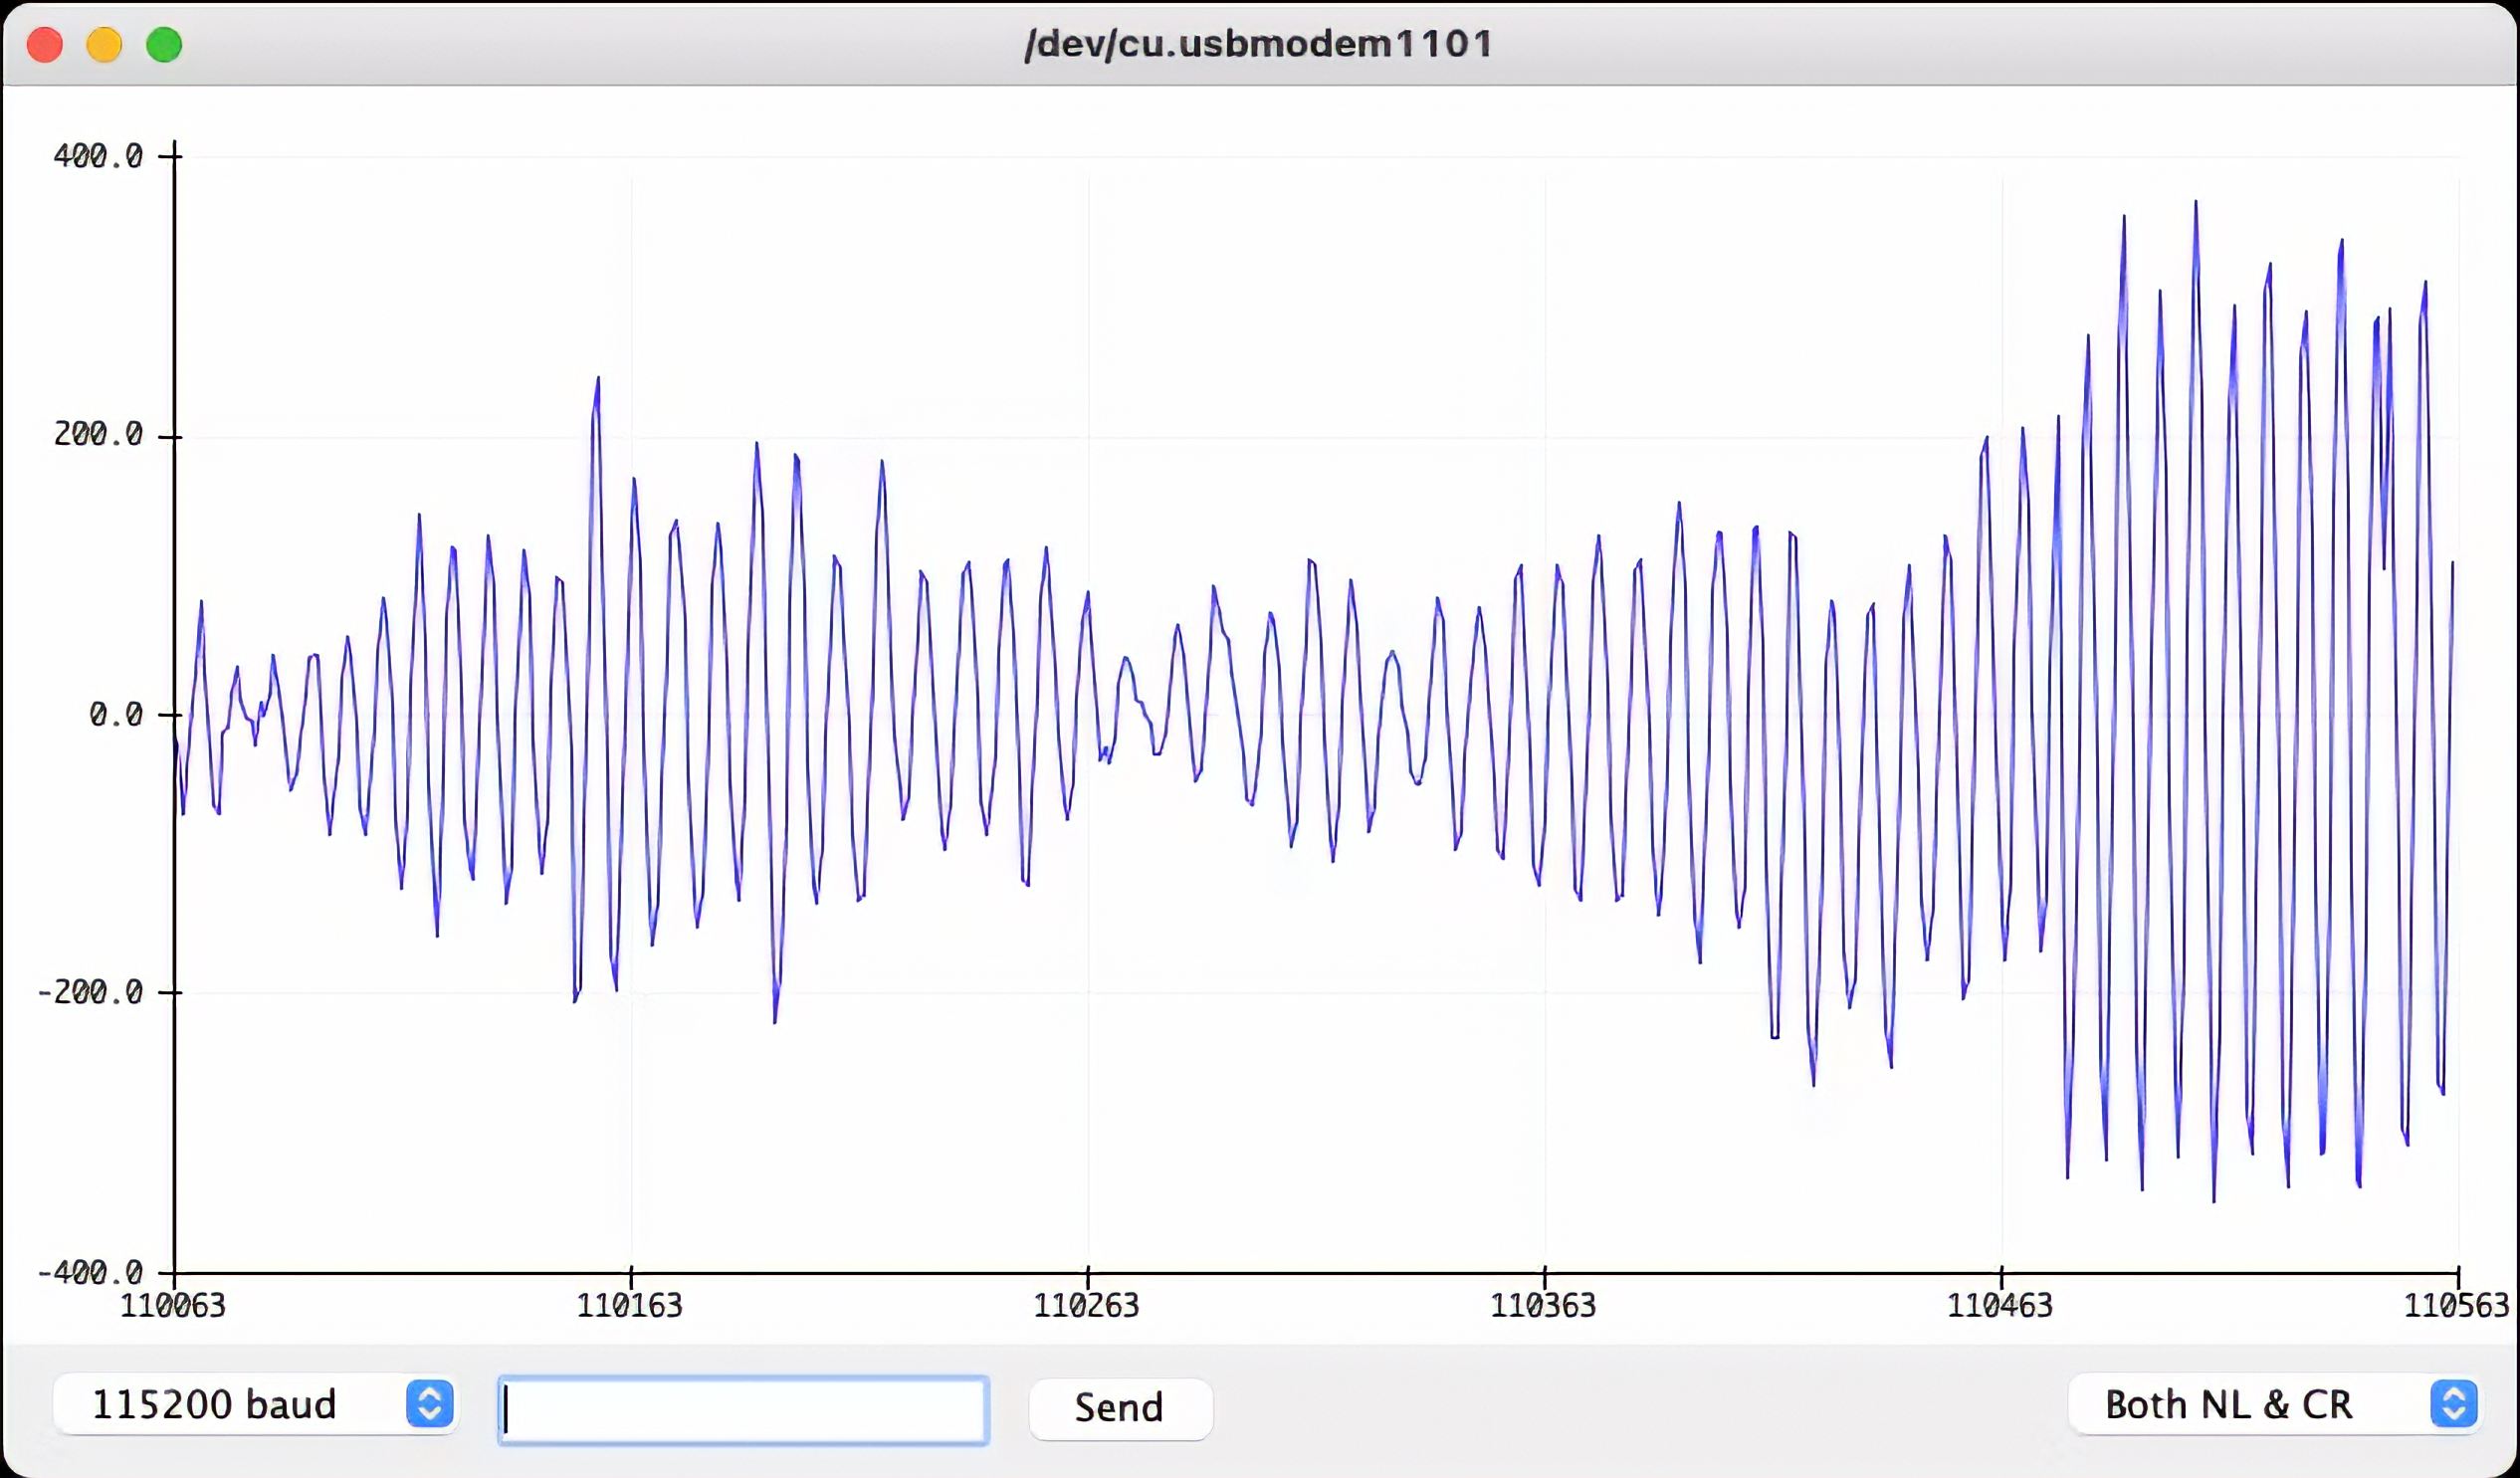
Also, note that the RGB LED will be set up depending on the intensity of sound.
> The Micrphone will not be used on this project in particular, but it is good to have it tested if it is your first time using the XIAO nRF52840 Sense.
### 4.2.3.3 Testing the IMU
Our tiny device also has integrated a 6-Axis IMU, the [LSM6DS3TR-C](https://files.seeedstudio.com/wiki/XIAO-BLE/ST_LSM6DS3TR_Datasheet.pdf), a system-in-package 3D digital accelerometer, and a 3D digital gyroscope. For testing, you should first install its library '[Seeed Arduino LSM6DS3](https://github.com/Seeed-Studio/Seeed_Arduino_LSM6DS3/)'.
Before programming the accelerometer with the Arduino IDE, you must add the necessary library for the sensor. Enter the library address 🔗 <https://github.com/Seeed-Studio/Seeed_Arduino_LSM6DS3/> in the browser address bar, go to the GitHub page, click `Code→Download ZIP` to download the resource pack `Seeed_Arduino_LSM6DS3-master.zip` to the local area, as shown below.
<!-- 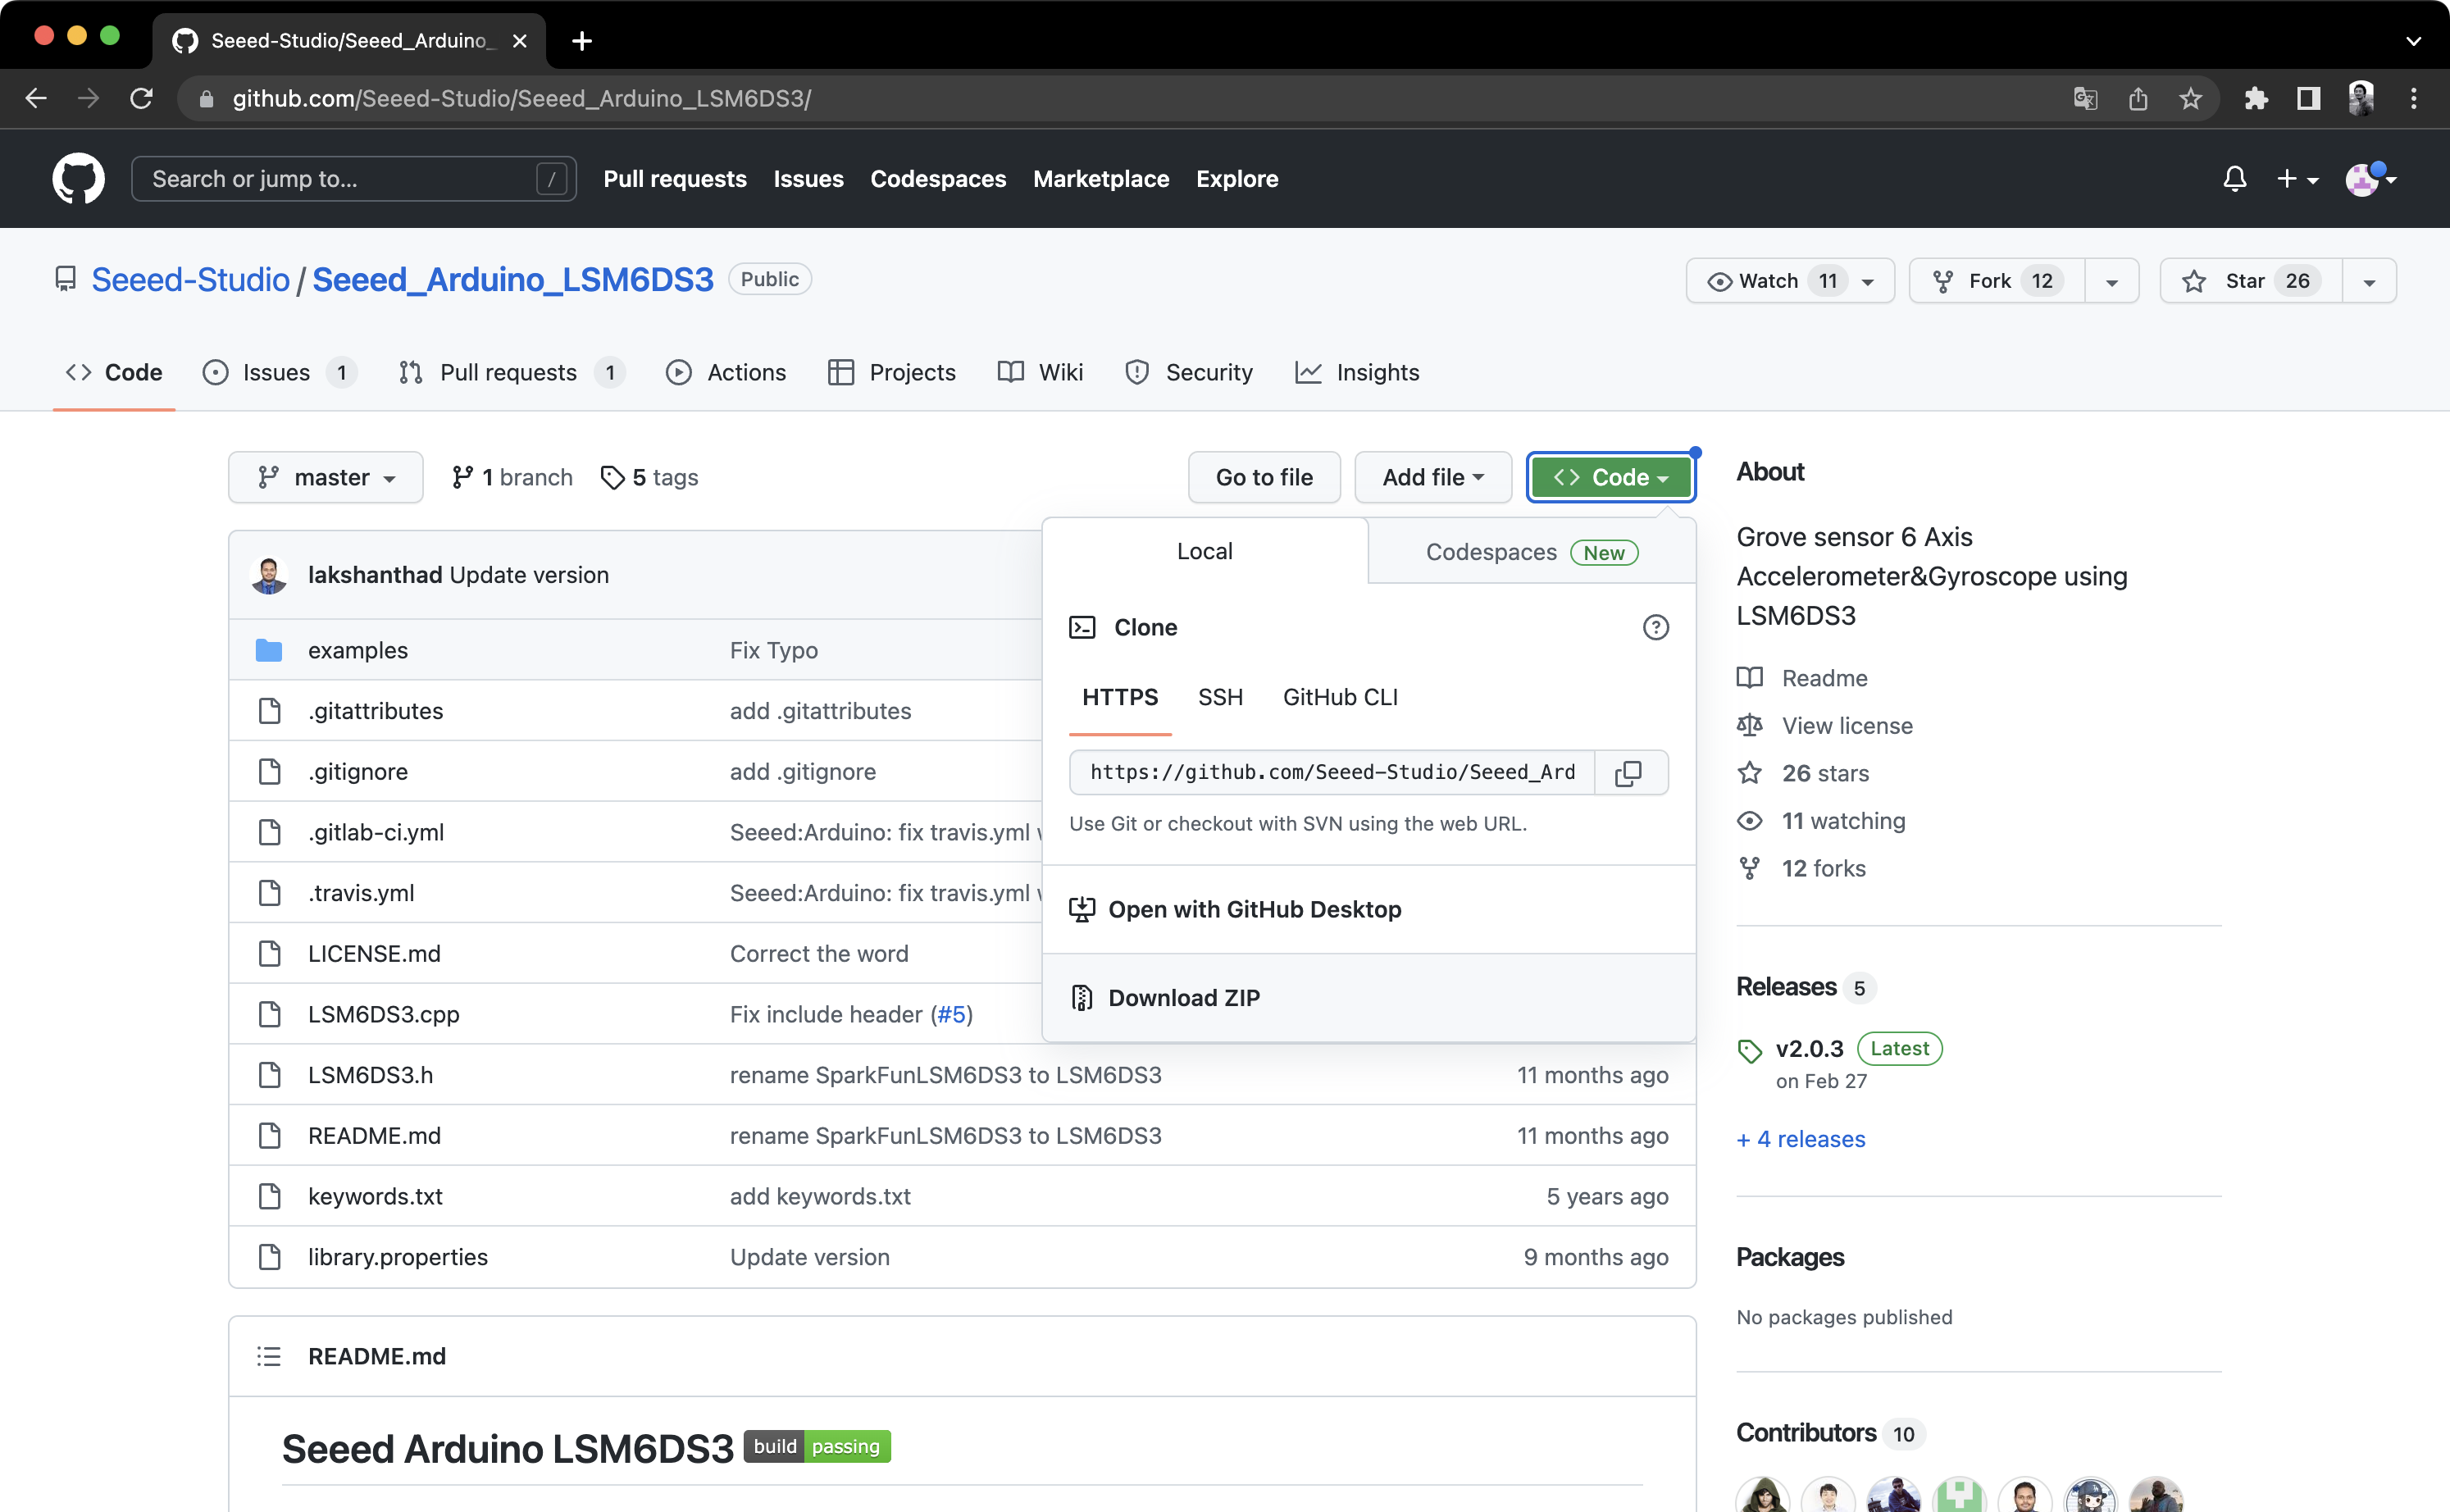 -->
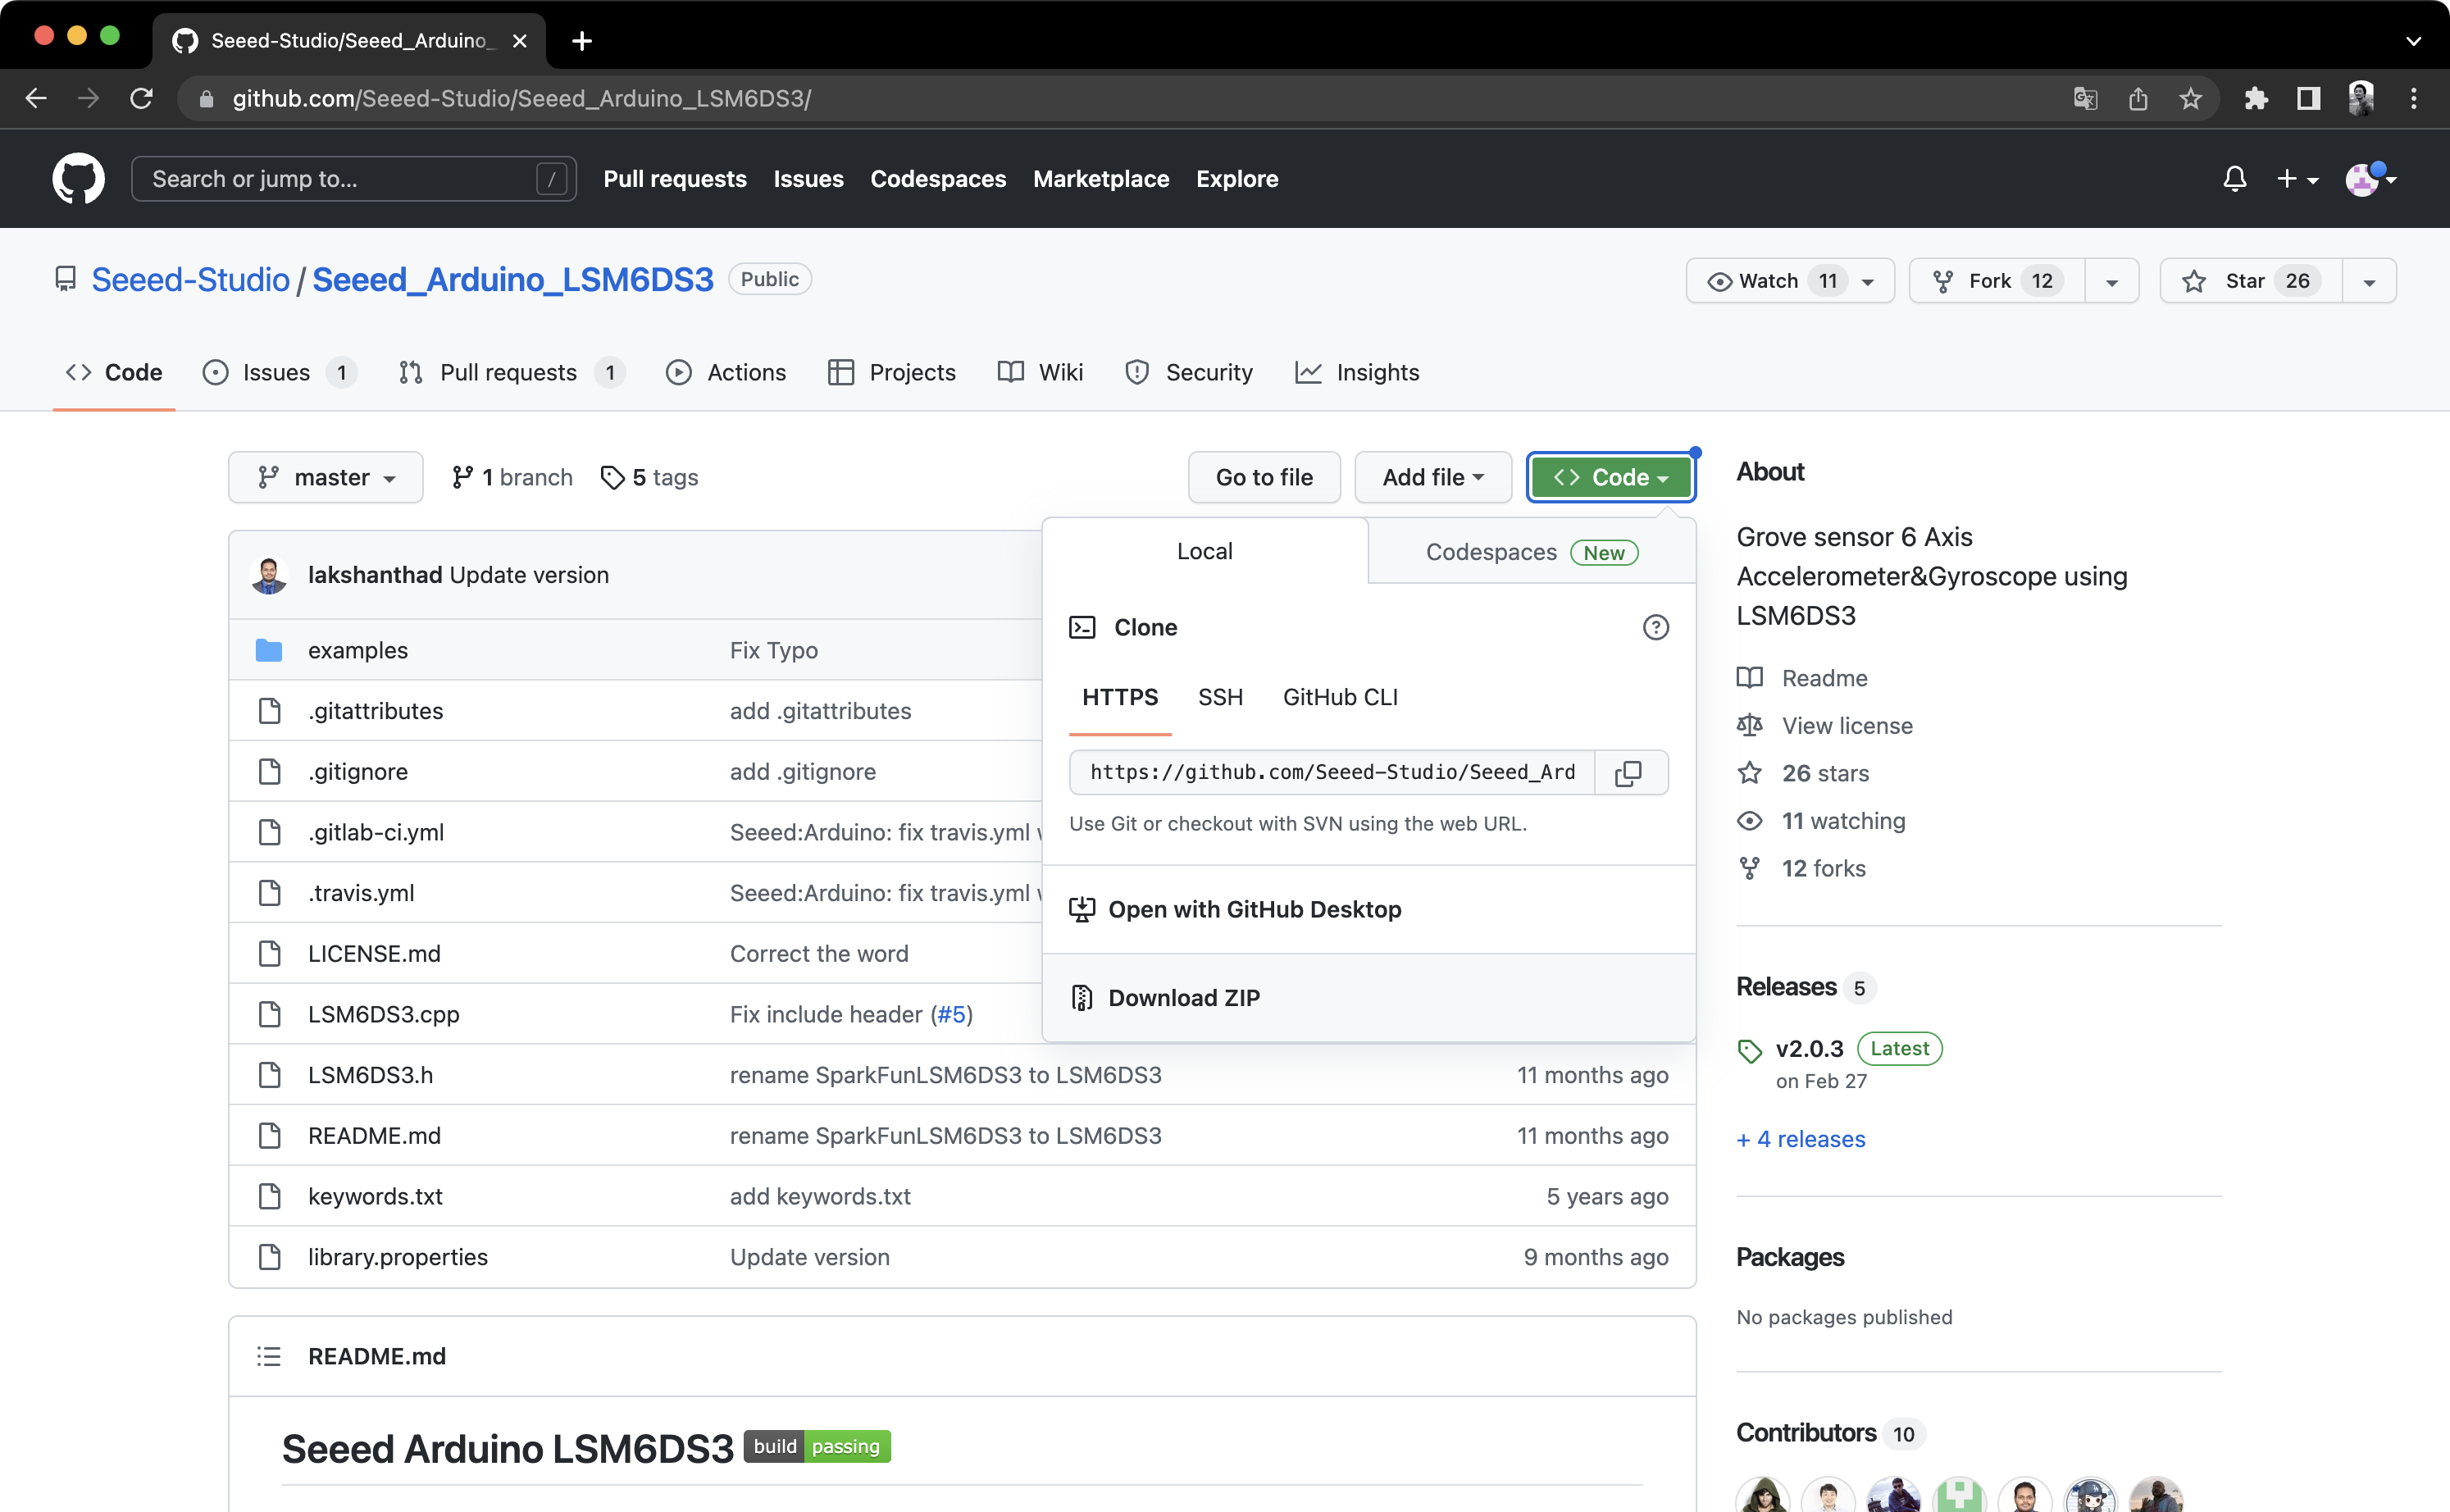
Add the resource pack `Seeed_Arduino_LSM6DS3-master.zip` downloaded in the previous step in the menu bar's `Sketch→Include Library→Add .ZIP Library` until you see a prompt that the library has been loaded successfully.
#### **Run the test code based on Harvard University's tinymlx - Sensor Test**
Now, run the following test code based on Harvard University's tinymlx - Sensor Test.
``` cpp
#include "LSM6DS3.h"
#include "Wire.h"
//Create an instance of class LSM6DS3
LSM6DS3 xIMU(I2C_MODE, 0x6A); //I2C device address 0x6A
char c;
int sign = 0;
void setup() {
Serial.begin(115200);
while (!Serial);
// configure the IMU
if (xIMU.begin() != 0) {
Serial.println("Device error");
} else {
Serial.println("Device OK!");
}
Serial.println("Welcome to the IMU test for the built-in IMU on the XIAO BLE Sense\n");
Serial.println("Available commands:");
Serial.println("a - display accelerometer readings in g's in x, y, and z directions");
Serial.println("g - display gyroscope readings in deg/s in x, y, and z directions");
Serial.println("t - display temperature readings in oC and oF");
}
void loop() {
// Read incoming commands from serial monitor
if (Serial.available()) {
c = Serial.read();
Serial.println(c);
}
if(c == 'a')sign=1;
else if(c == 'g')sign=2;
else if(c == 't')sign=3;
float x, y, z;
if (sign ==1) { // testing accelerometer
//Accelerometer
x = xIMU.readFloatAccelX();
y = xIMU.readFloatAccelY();
z = xIMU.readFloatAccelZ();
Serial.print("\nAccelerometer:\n");
Serial.print("Ax:");
Serial.print(x);
Serial.print(' ');
Serial.print("Ay:");
Serial.print(y);
Serial.print(' ');
Serial.print("Az:");
Serial.println(z);
}
else if (sign ==2) { // testing gyroscope
//Gyroscope
Serial.print("\nGyroscope:\n");
x = xIMU.readFloatGyroX();
y = xIMU.readFloatGyroY();
z = xIMU.readFloatGyroZ();
Serial.print("wx:");
Serial.print(x);
Serial.print(' ');
Serial.print("wy:");
Serial.print(y);
Serial.print(' ');
Serial.print("wz:");
Serial.println(z);
}
else if (sign ==3) { // testing thermometer
//Thermometer
Serial.print("\nThermometer:\n");
Serial.print(" Degrees oC = ");
Serial.println(xIMU.readTempC(), 0);
Serial.print(" Degrees oF = ");
Serial.println(xIMU.readTempF(), 0);
delay(1000);
}
}
```
> Get this code online 🔗 <br />
> <https://github.com/Mjrovai/Seeed-XIAO-BLE-Sense/blob/main/xiao_test_IMU/xiao_test_IMU.ino>
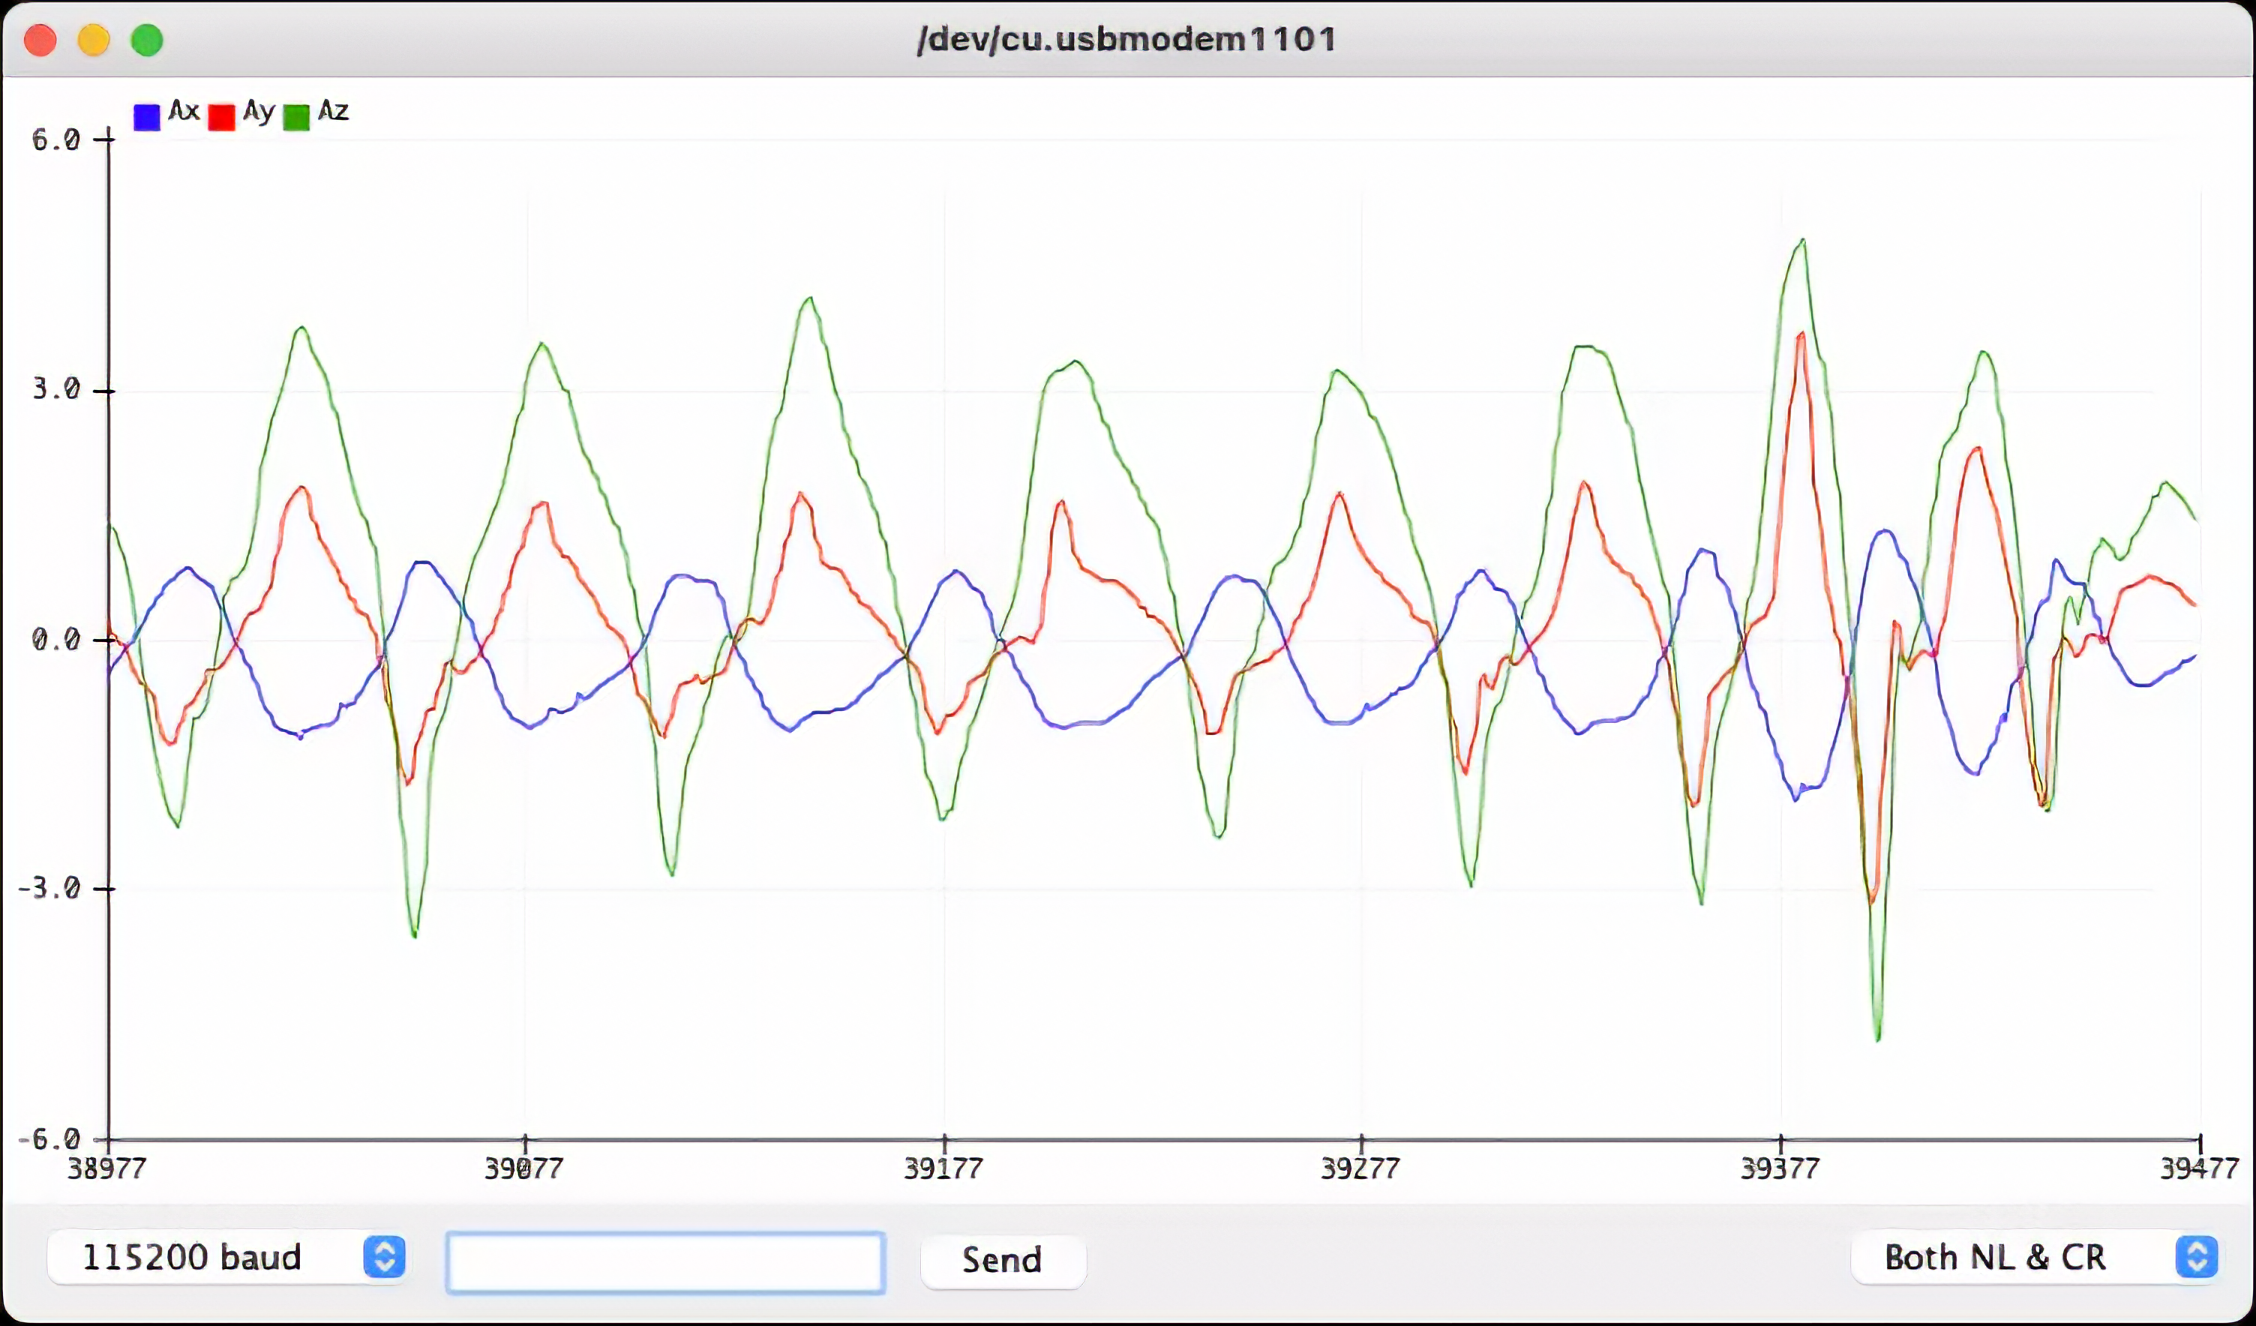
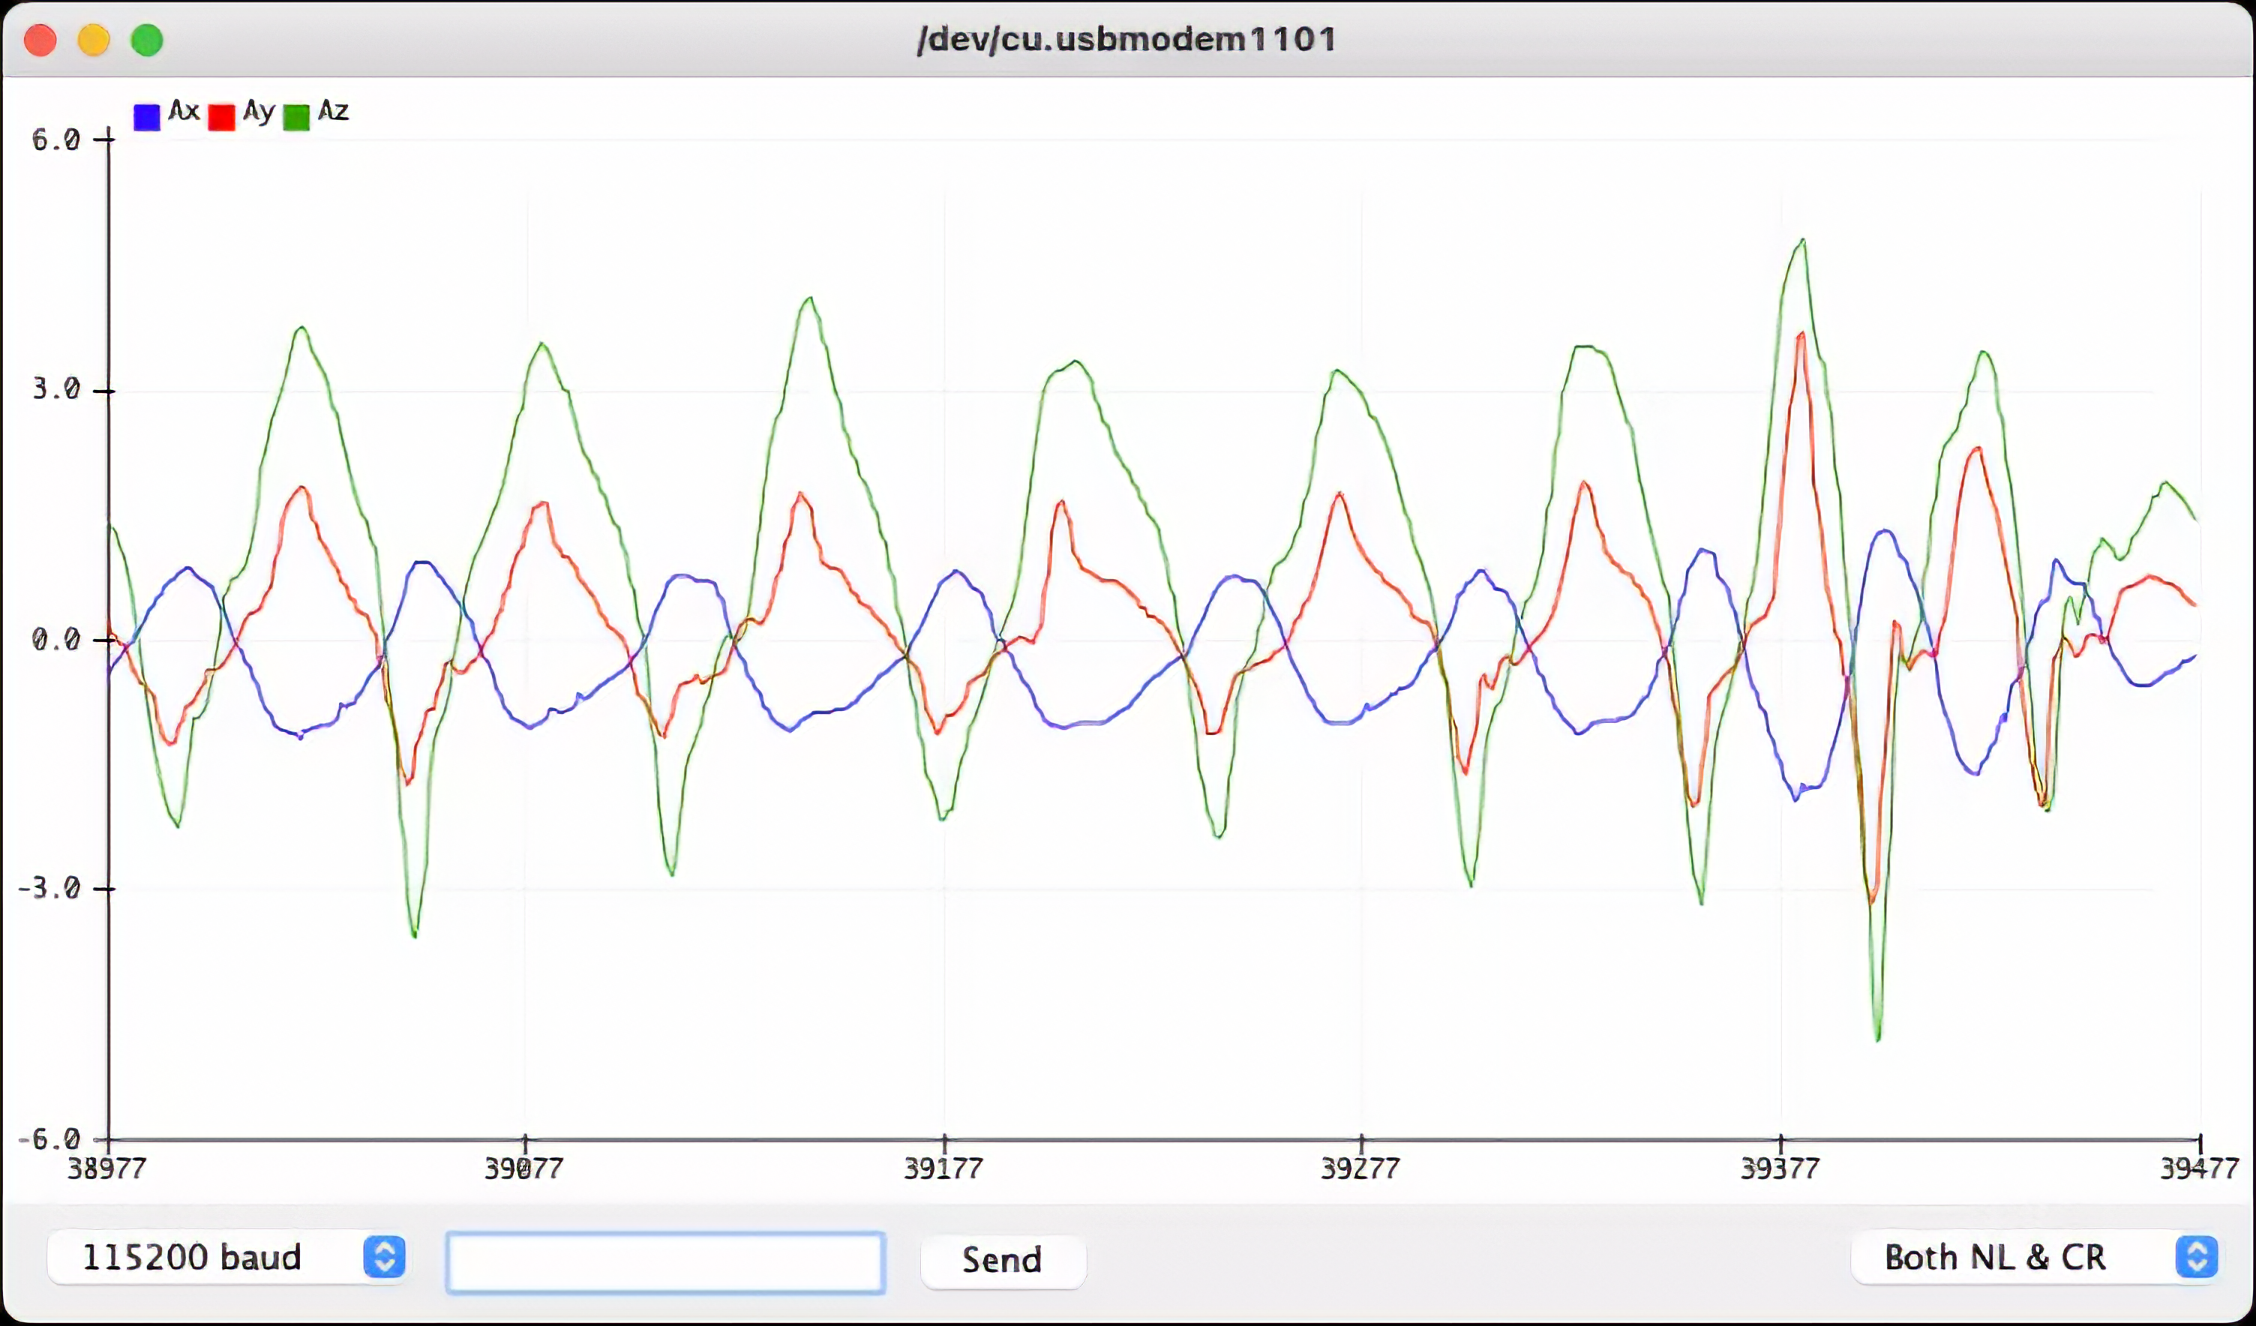
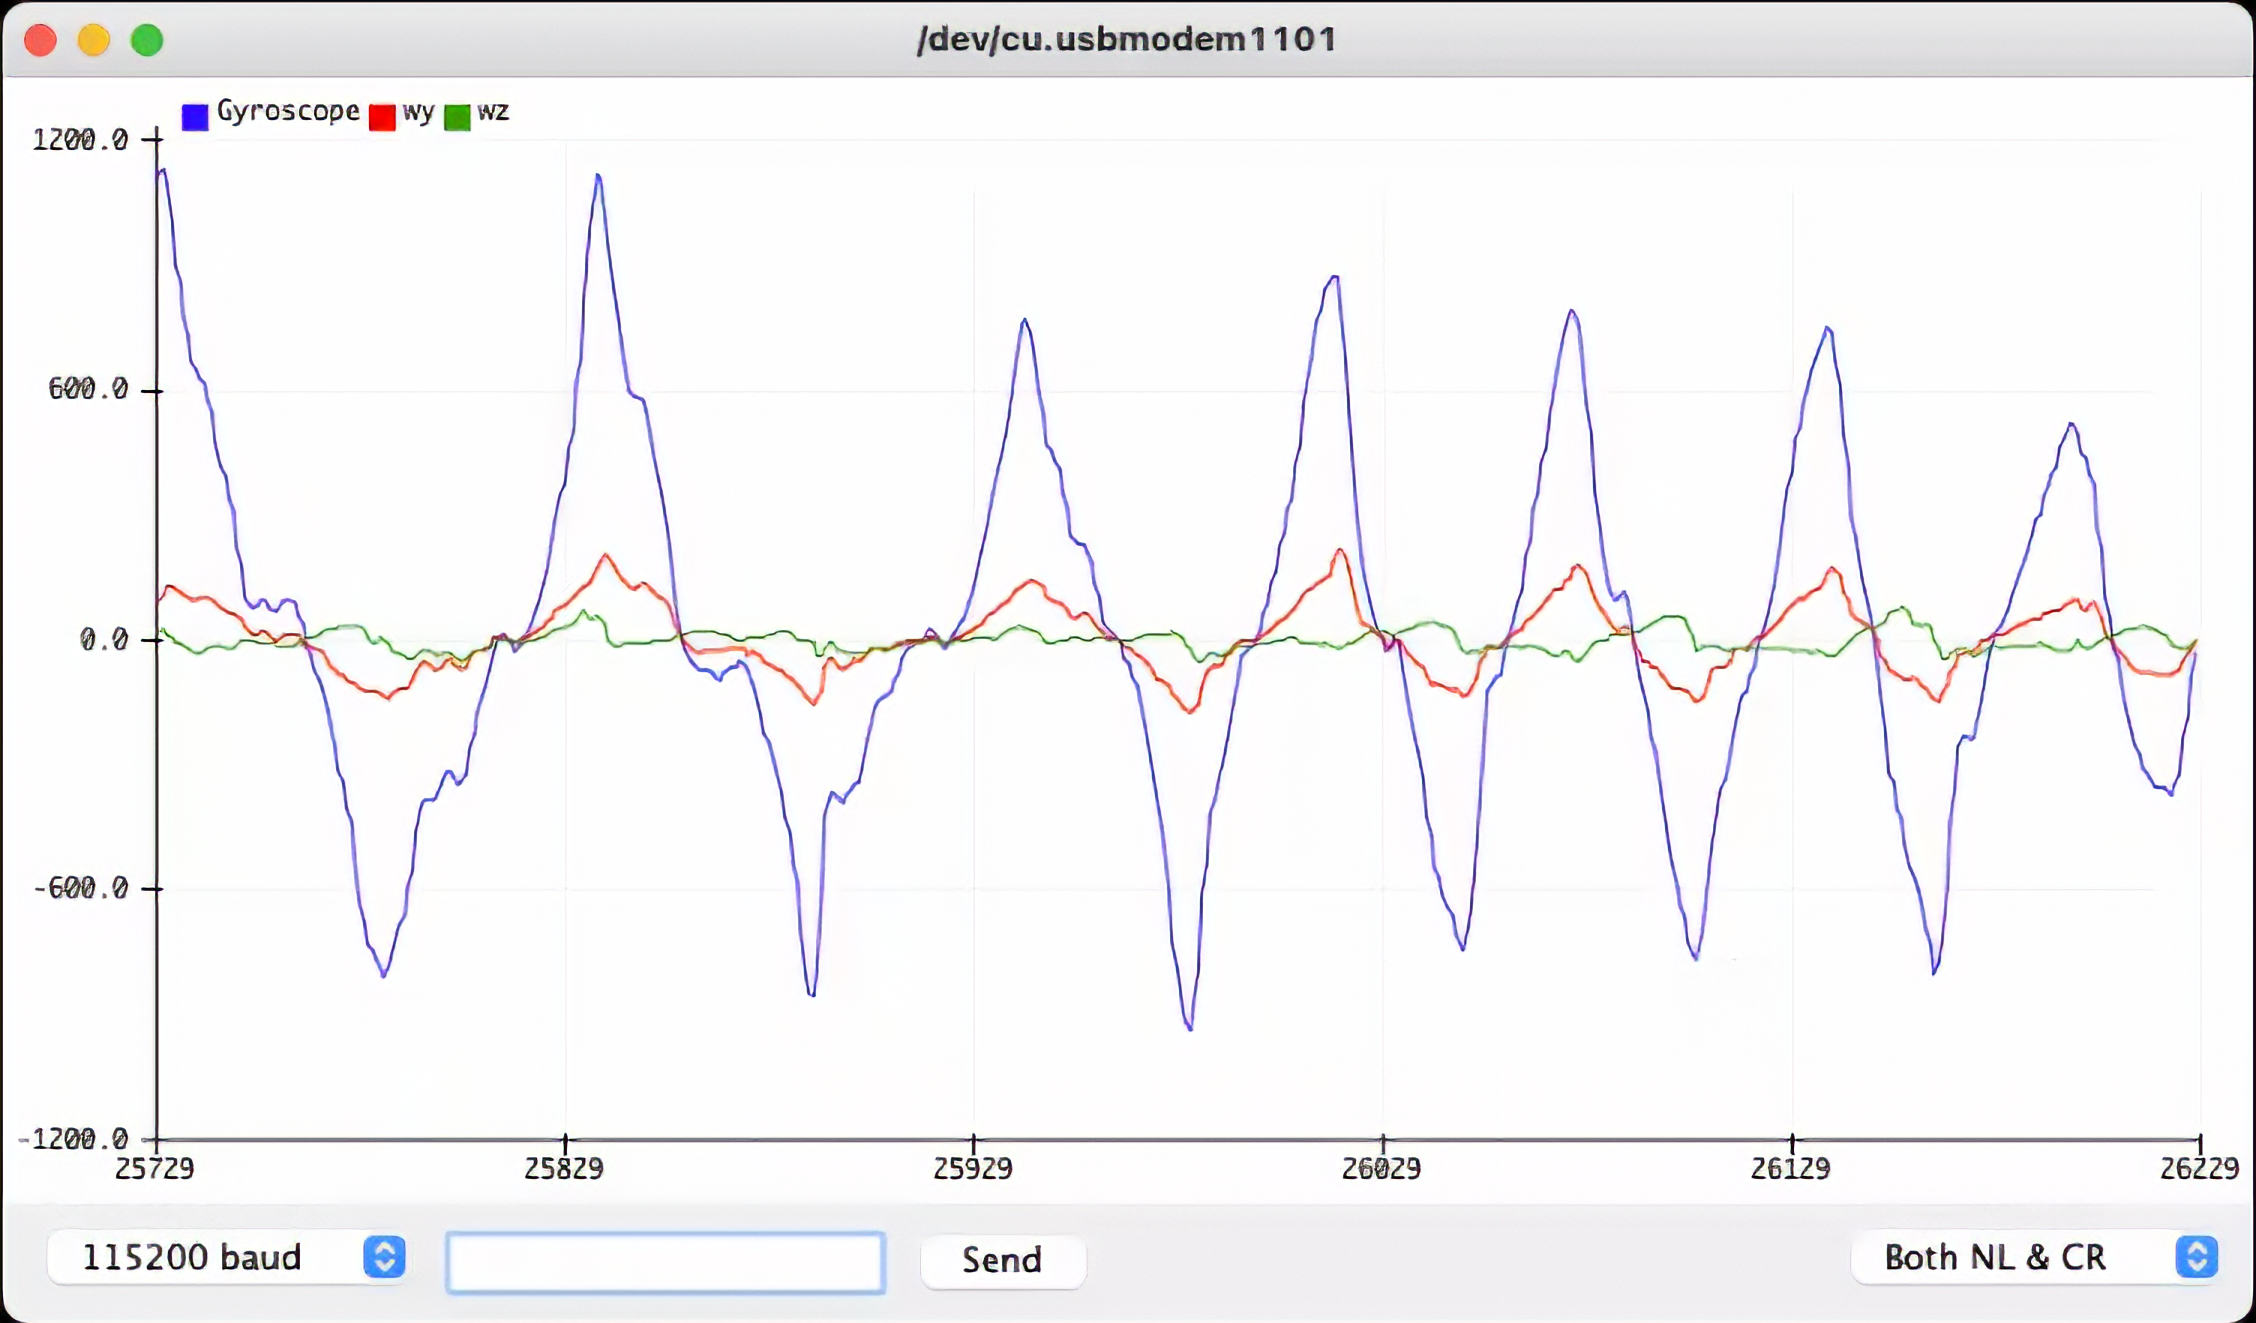
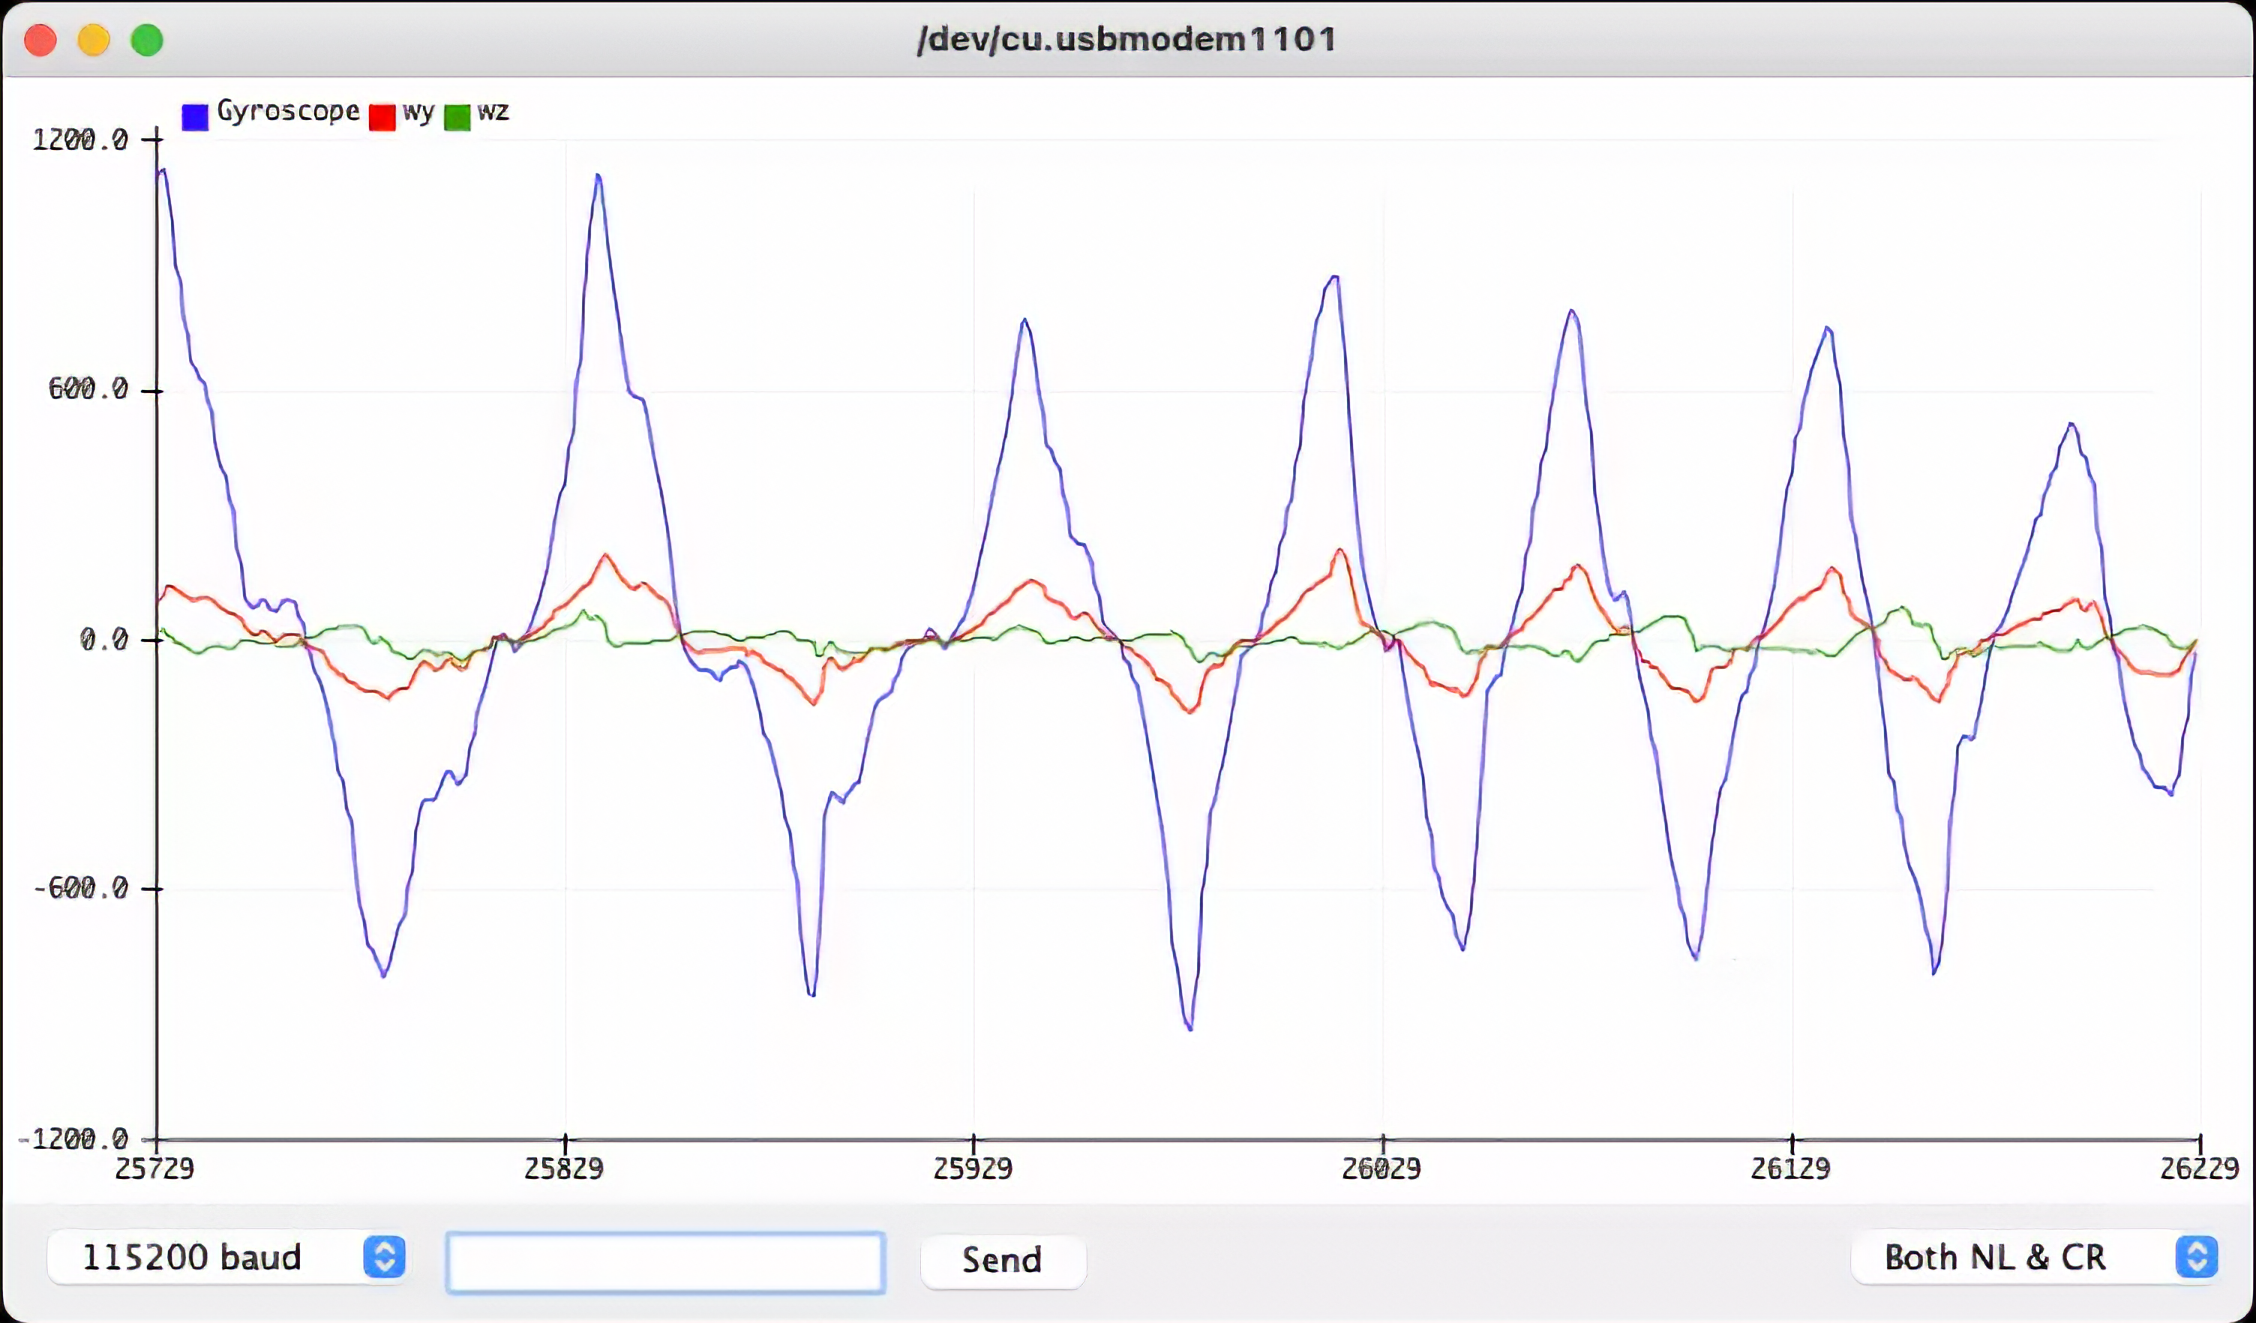
Once you run the above sketch, open the Serial Monitor:
<!-- 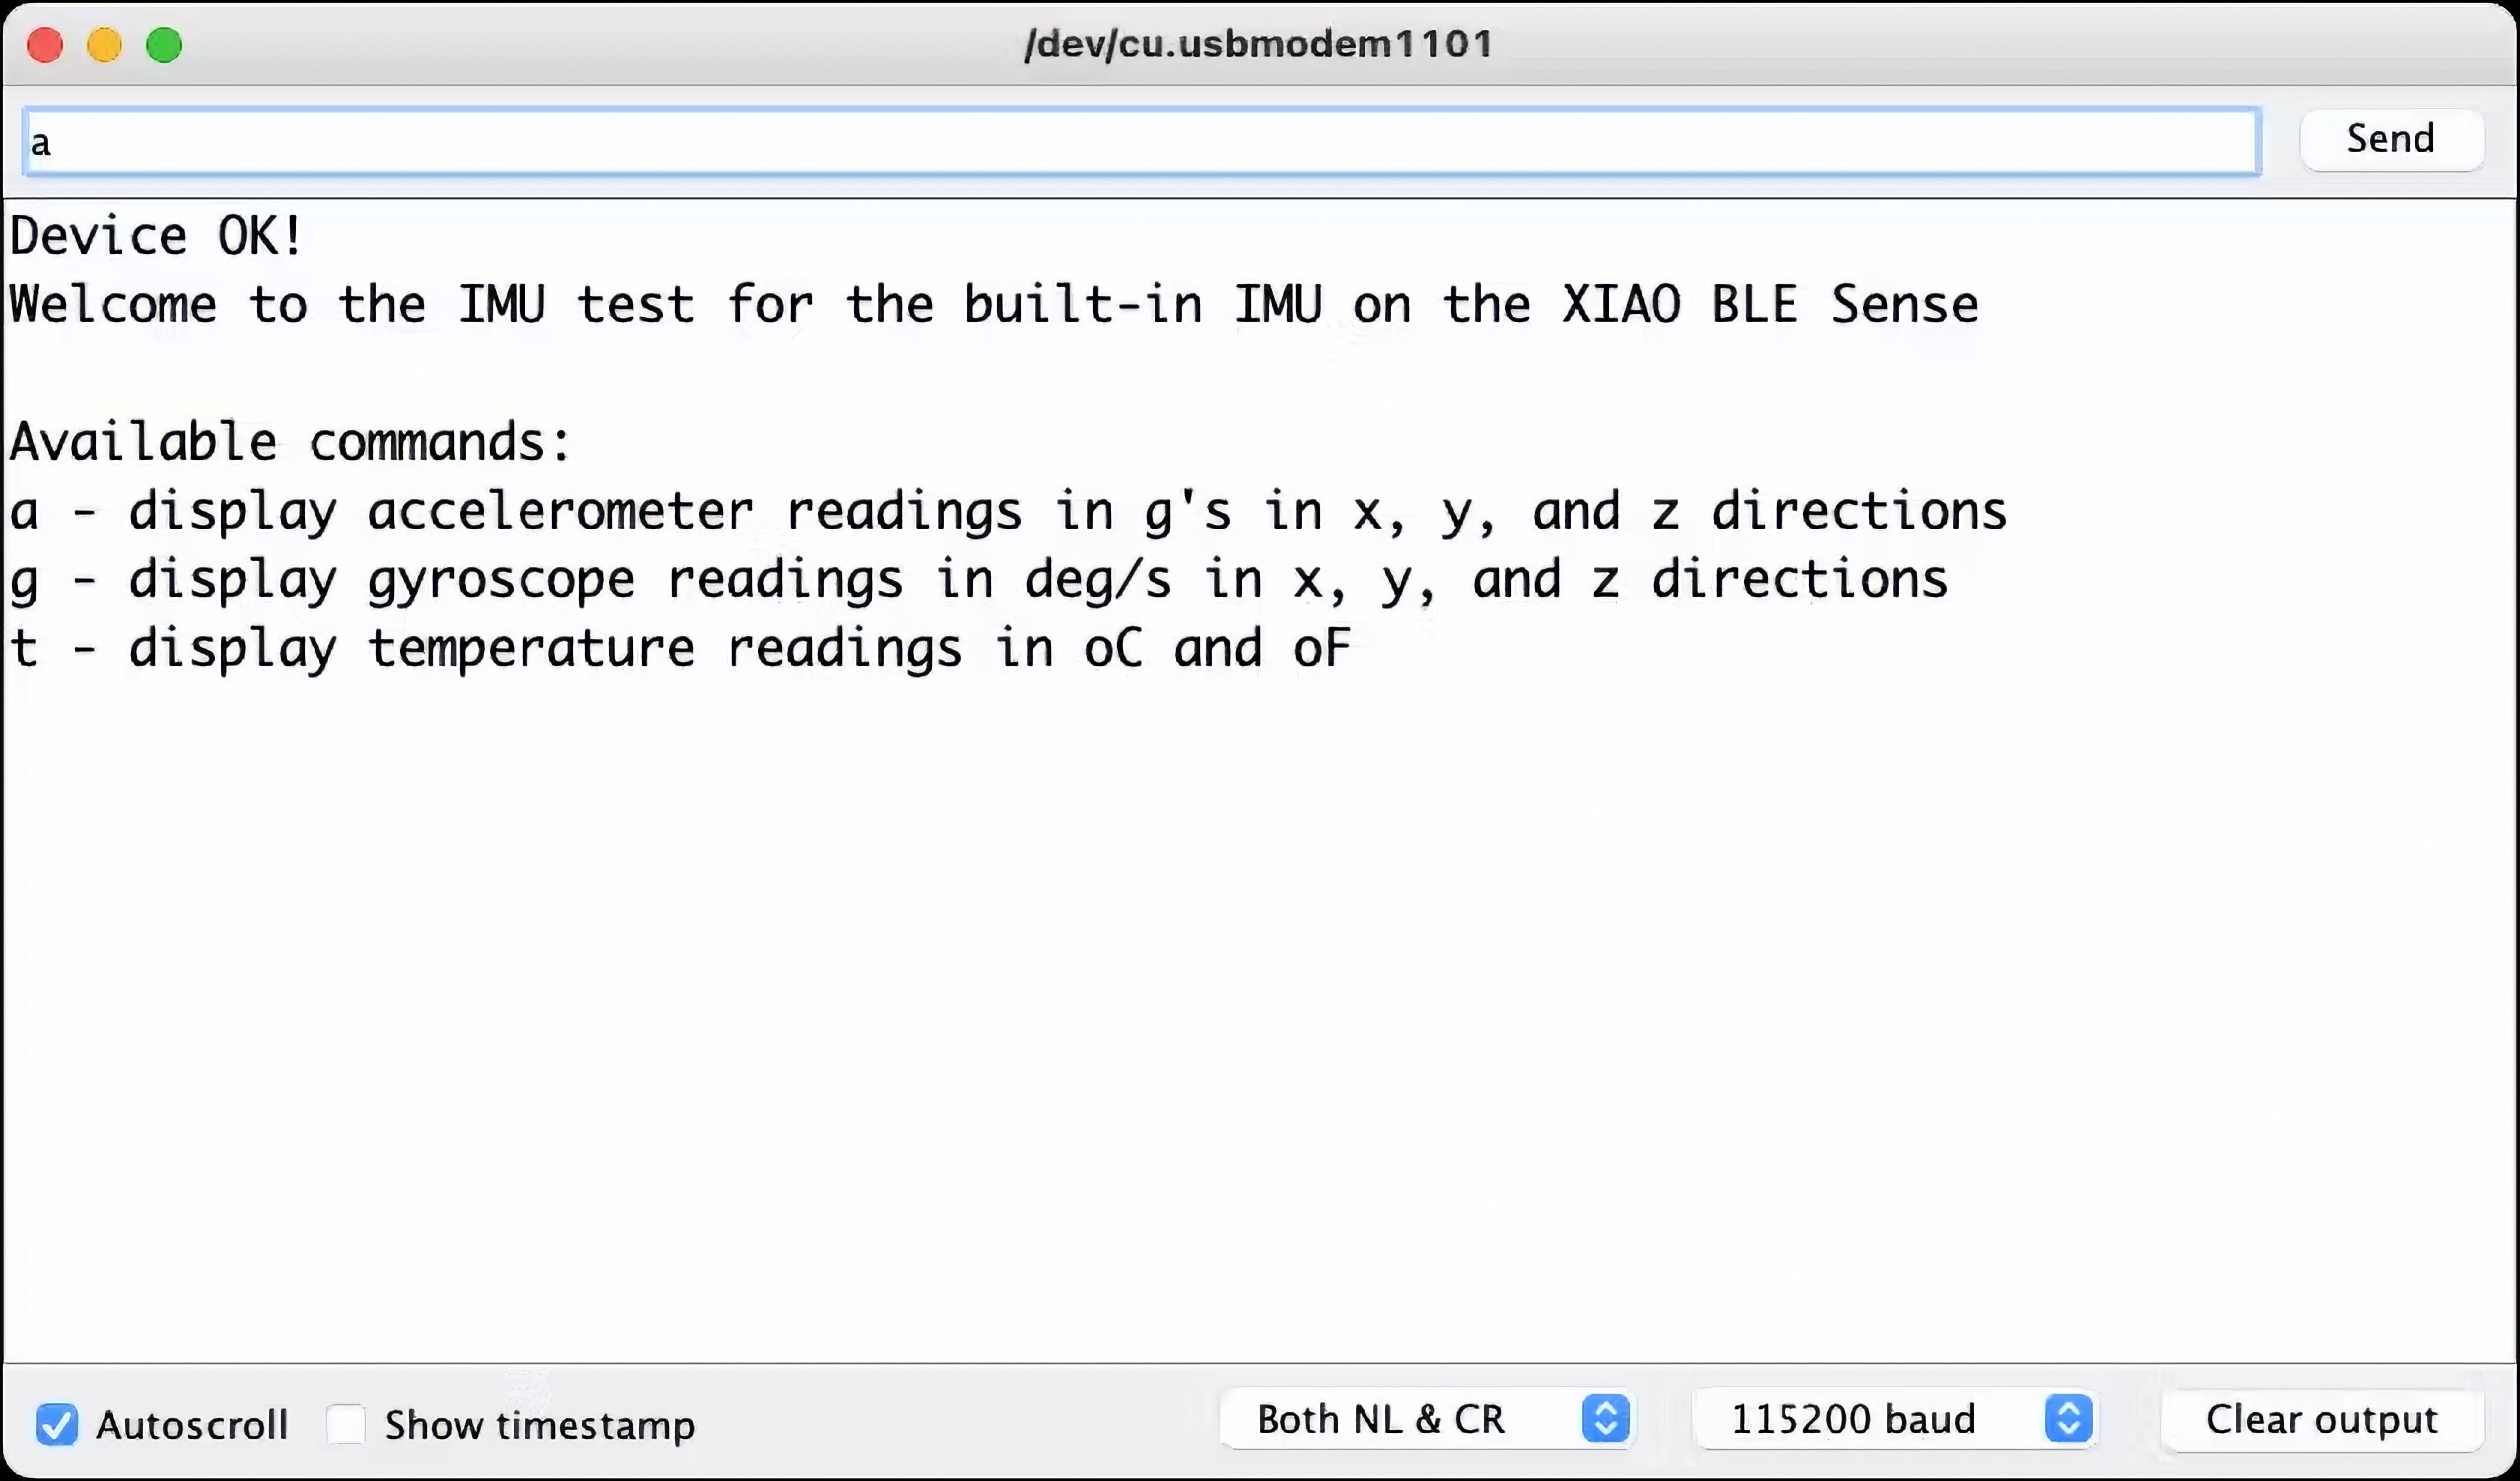 -->
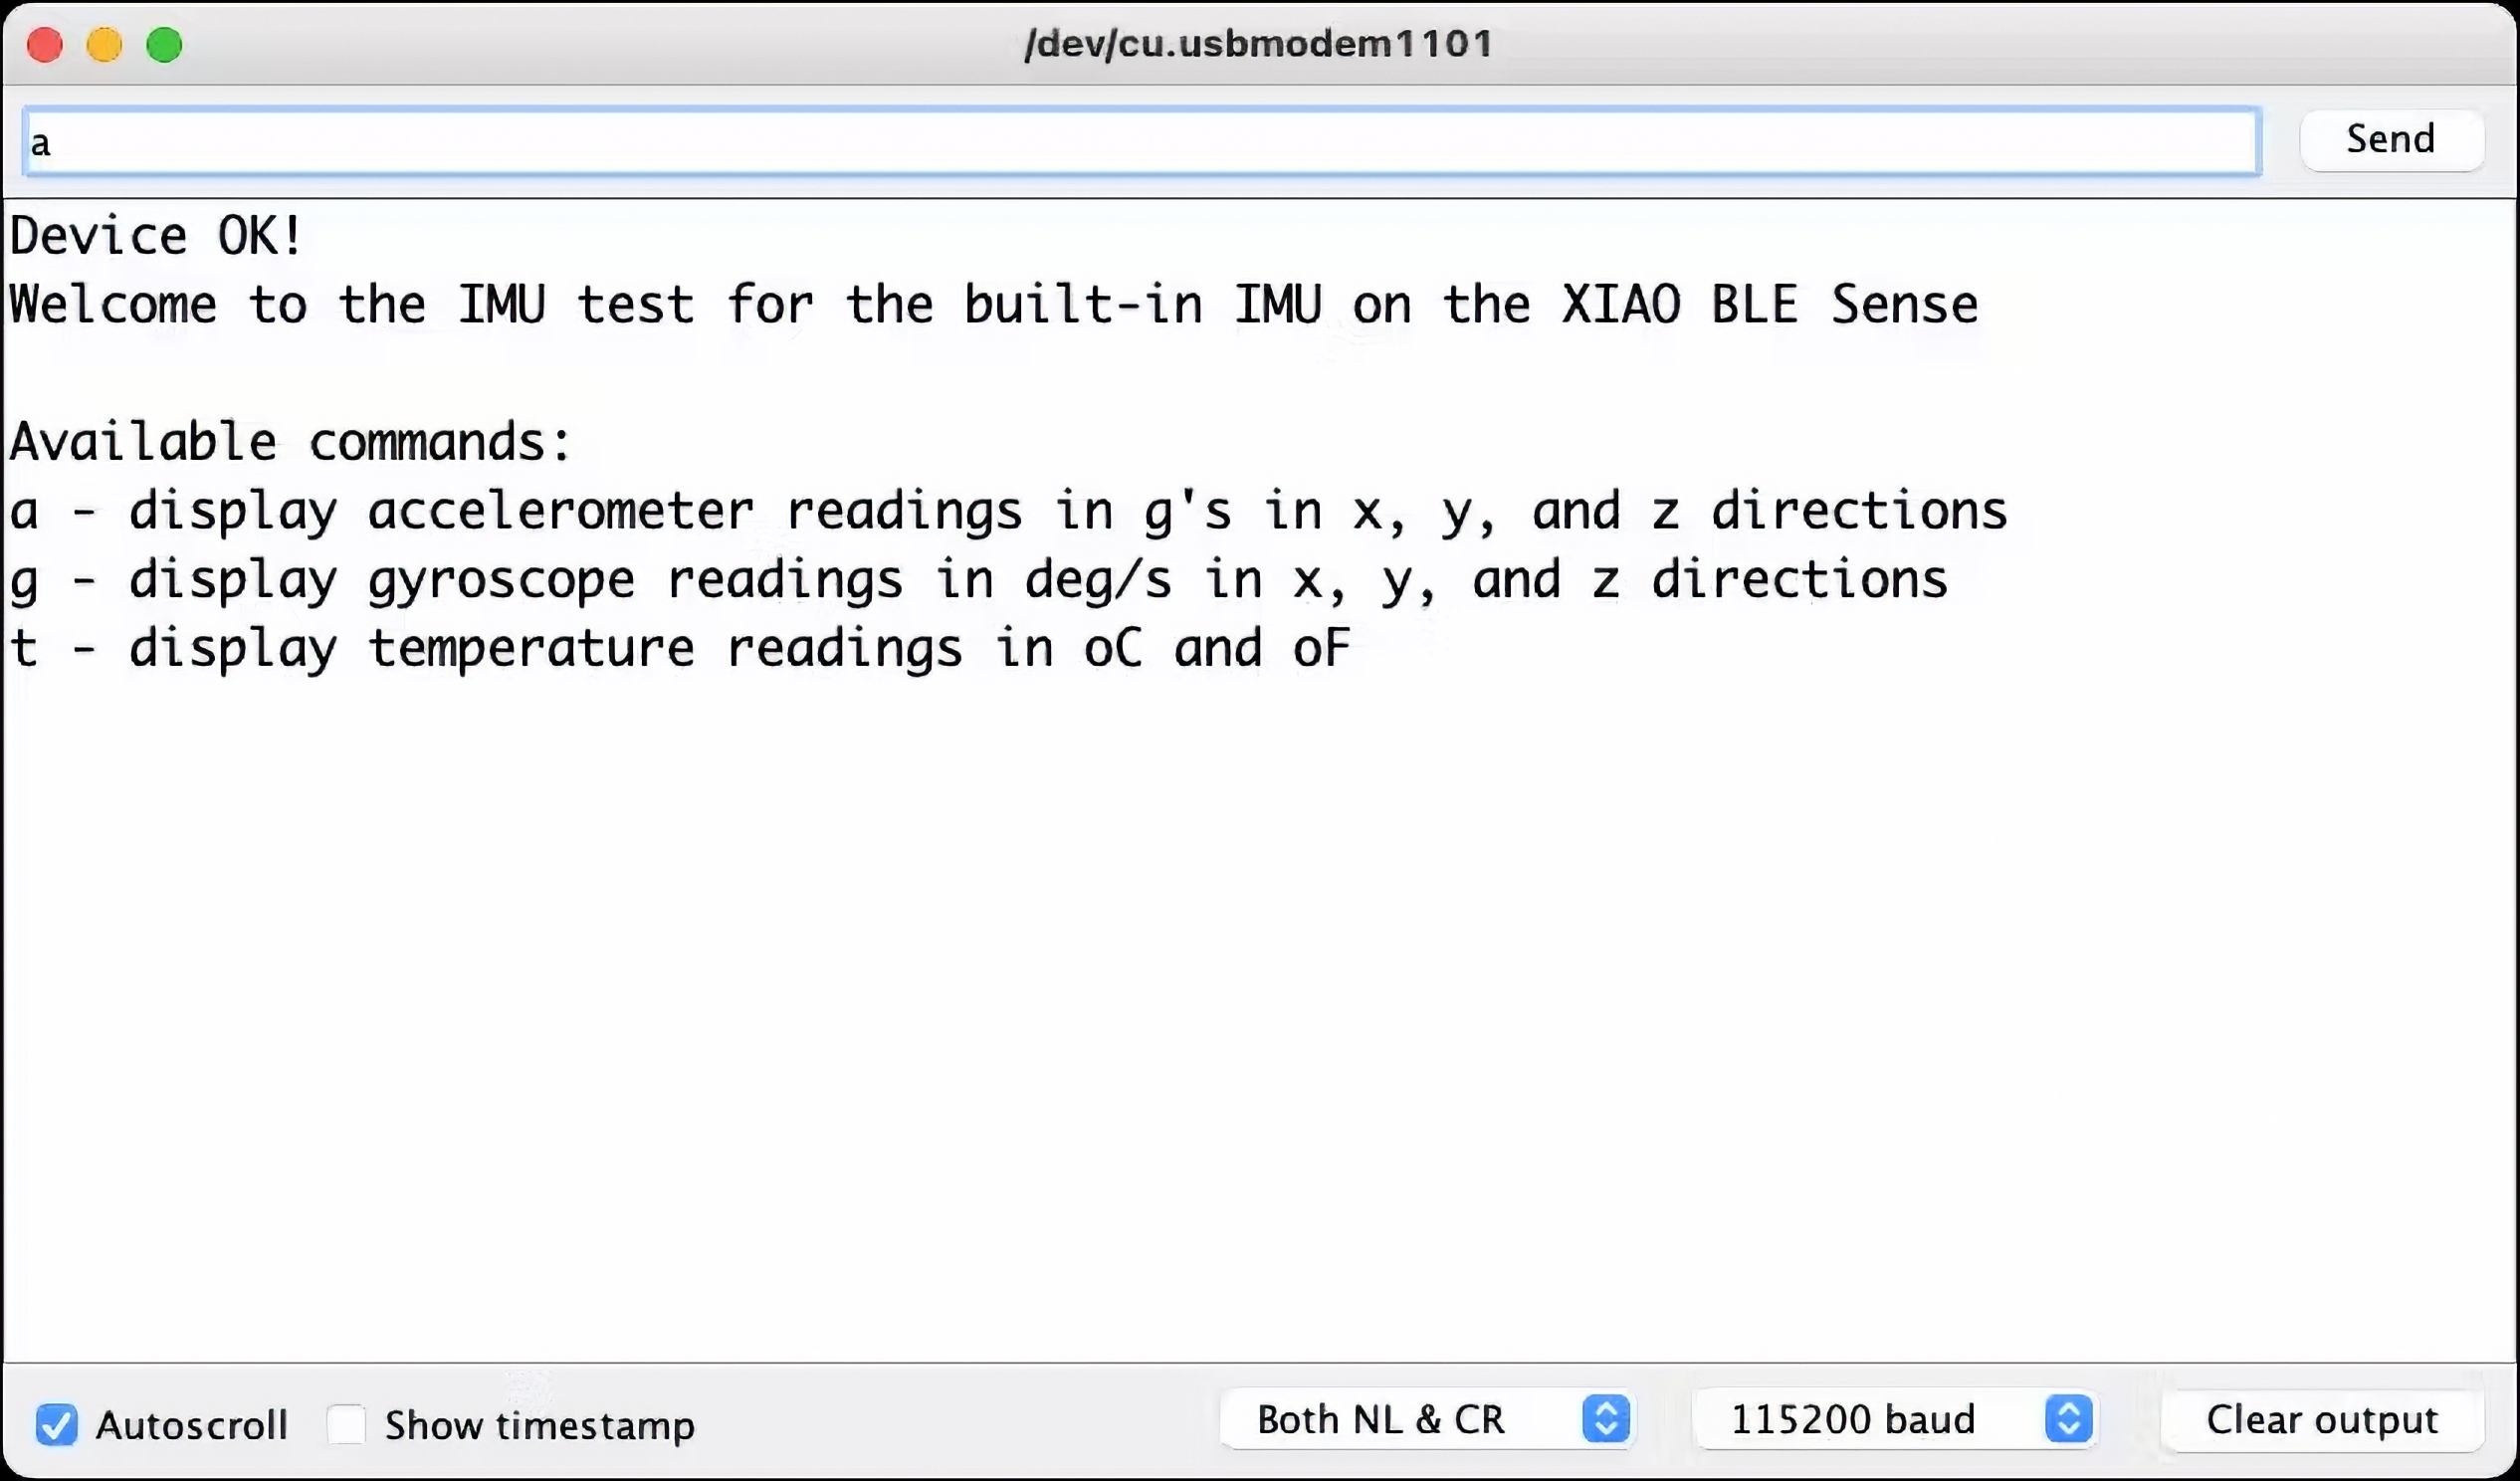
Choose one of the three options to test:
- **a**: Accelerometer (see the result on Plotter)
- **g**: Gyroscope (see the result on Plotter)
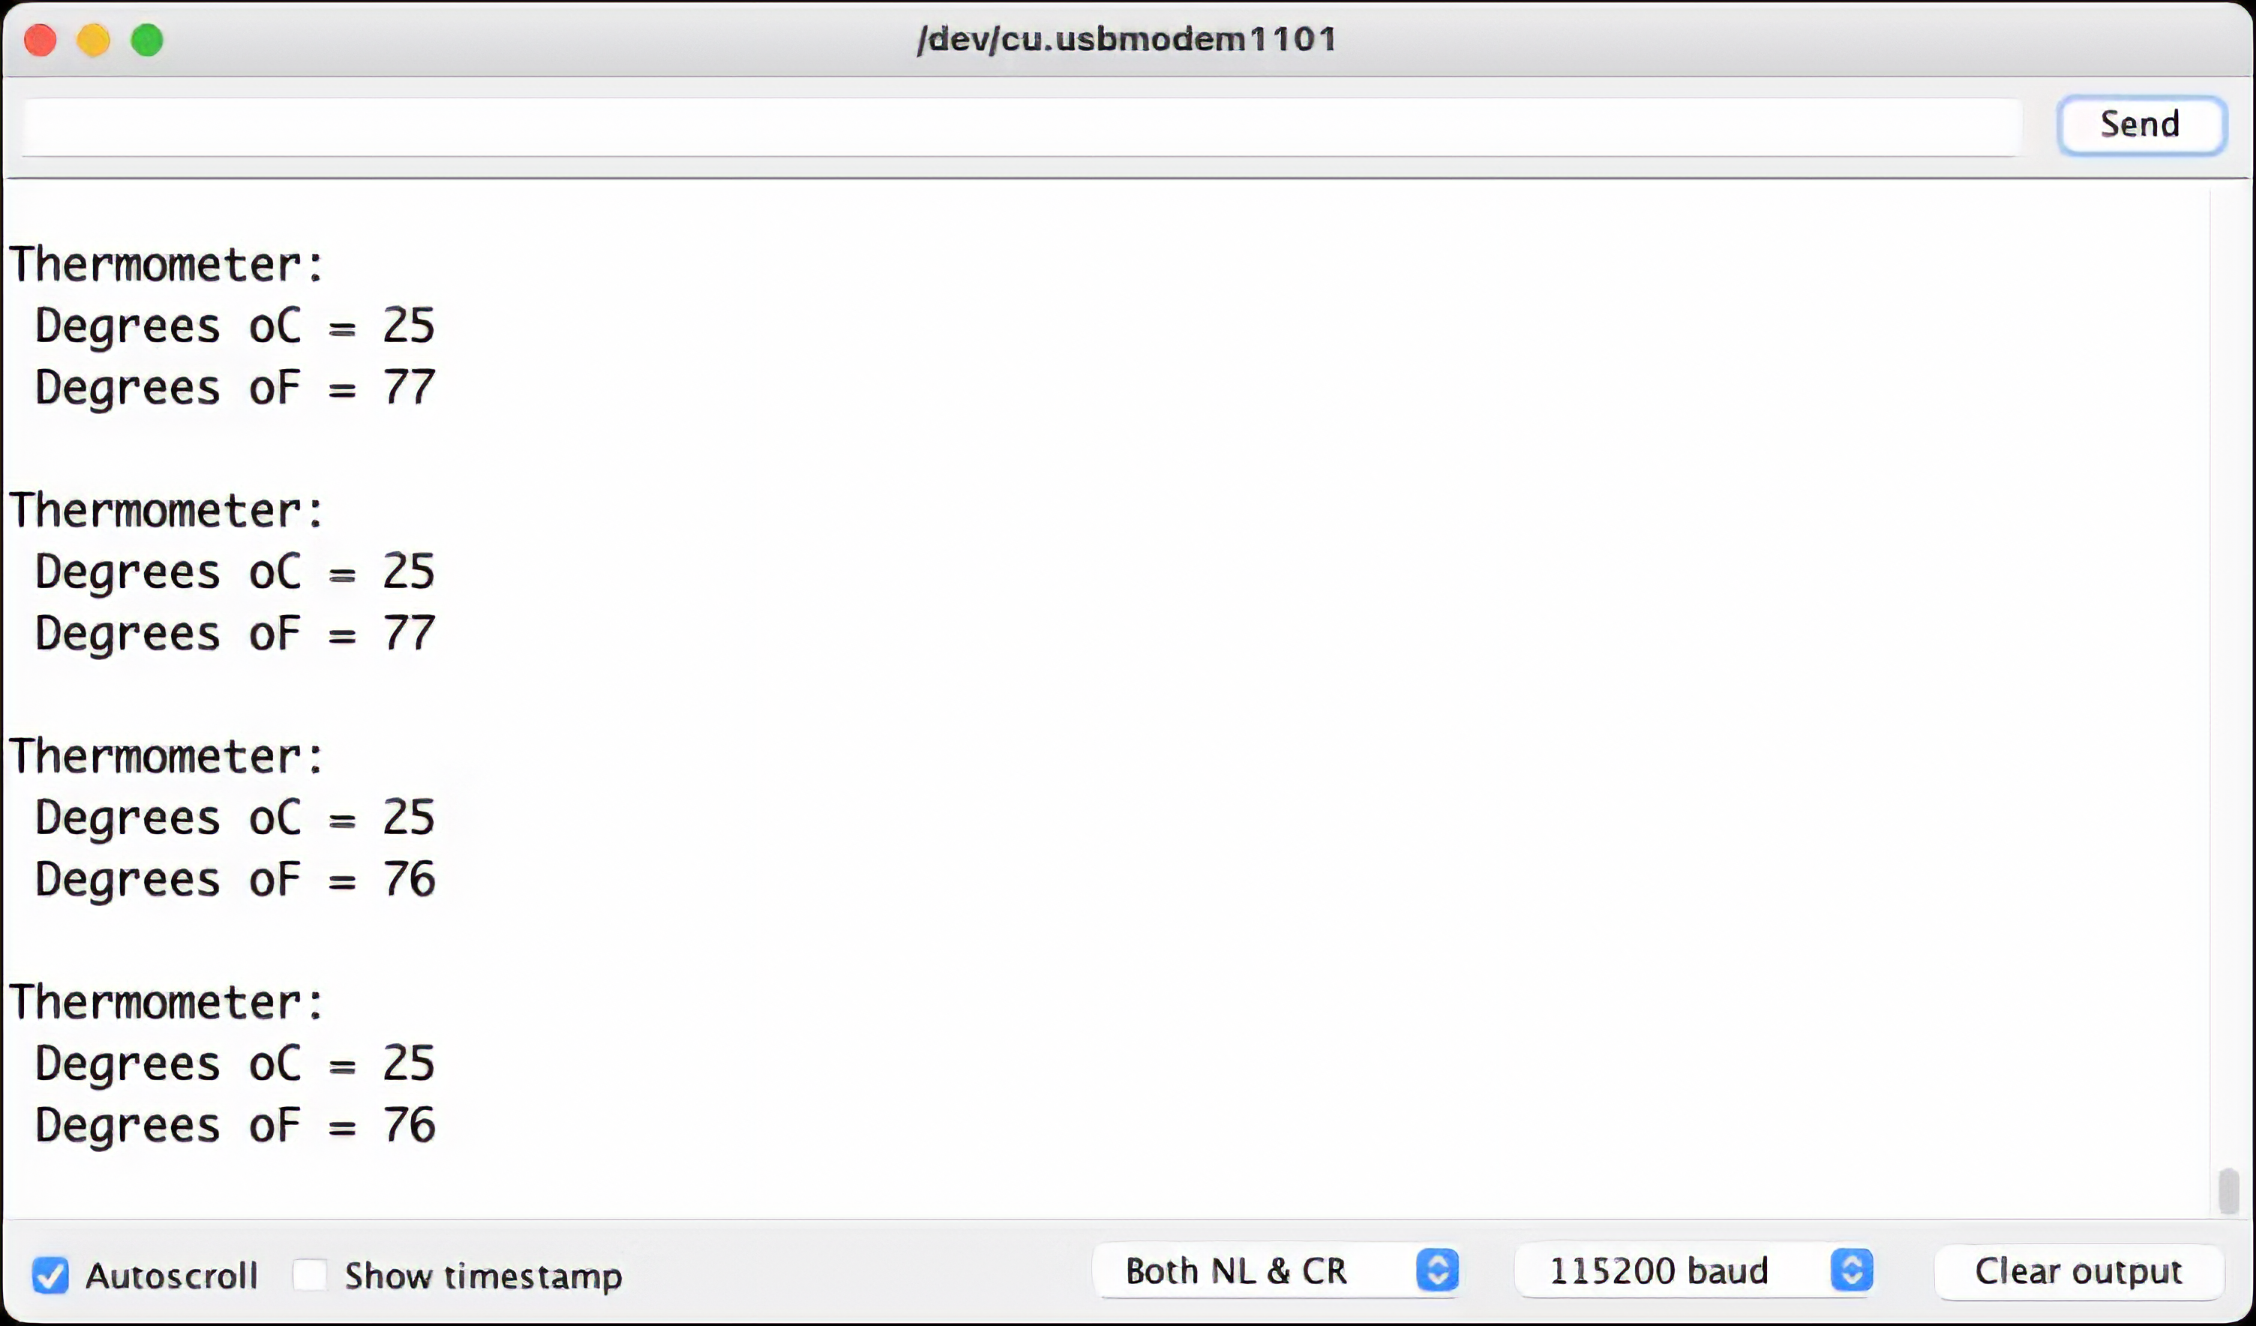
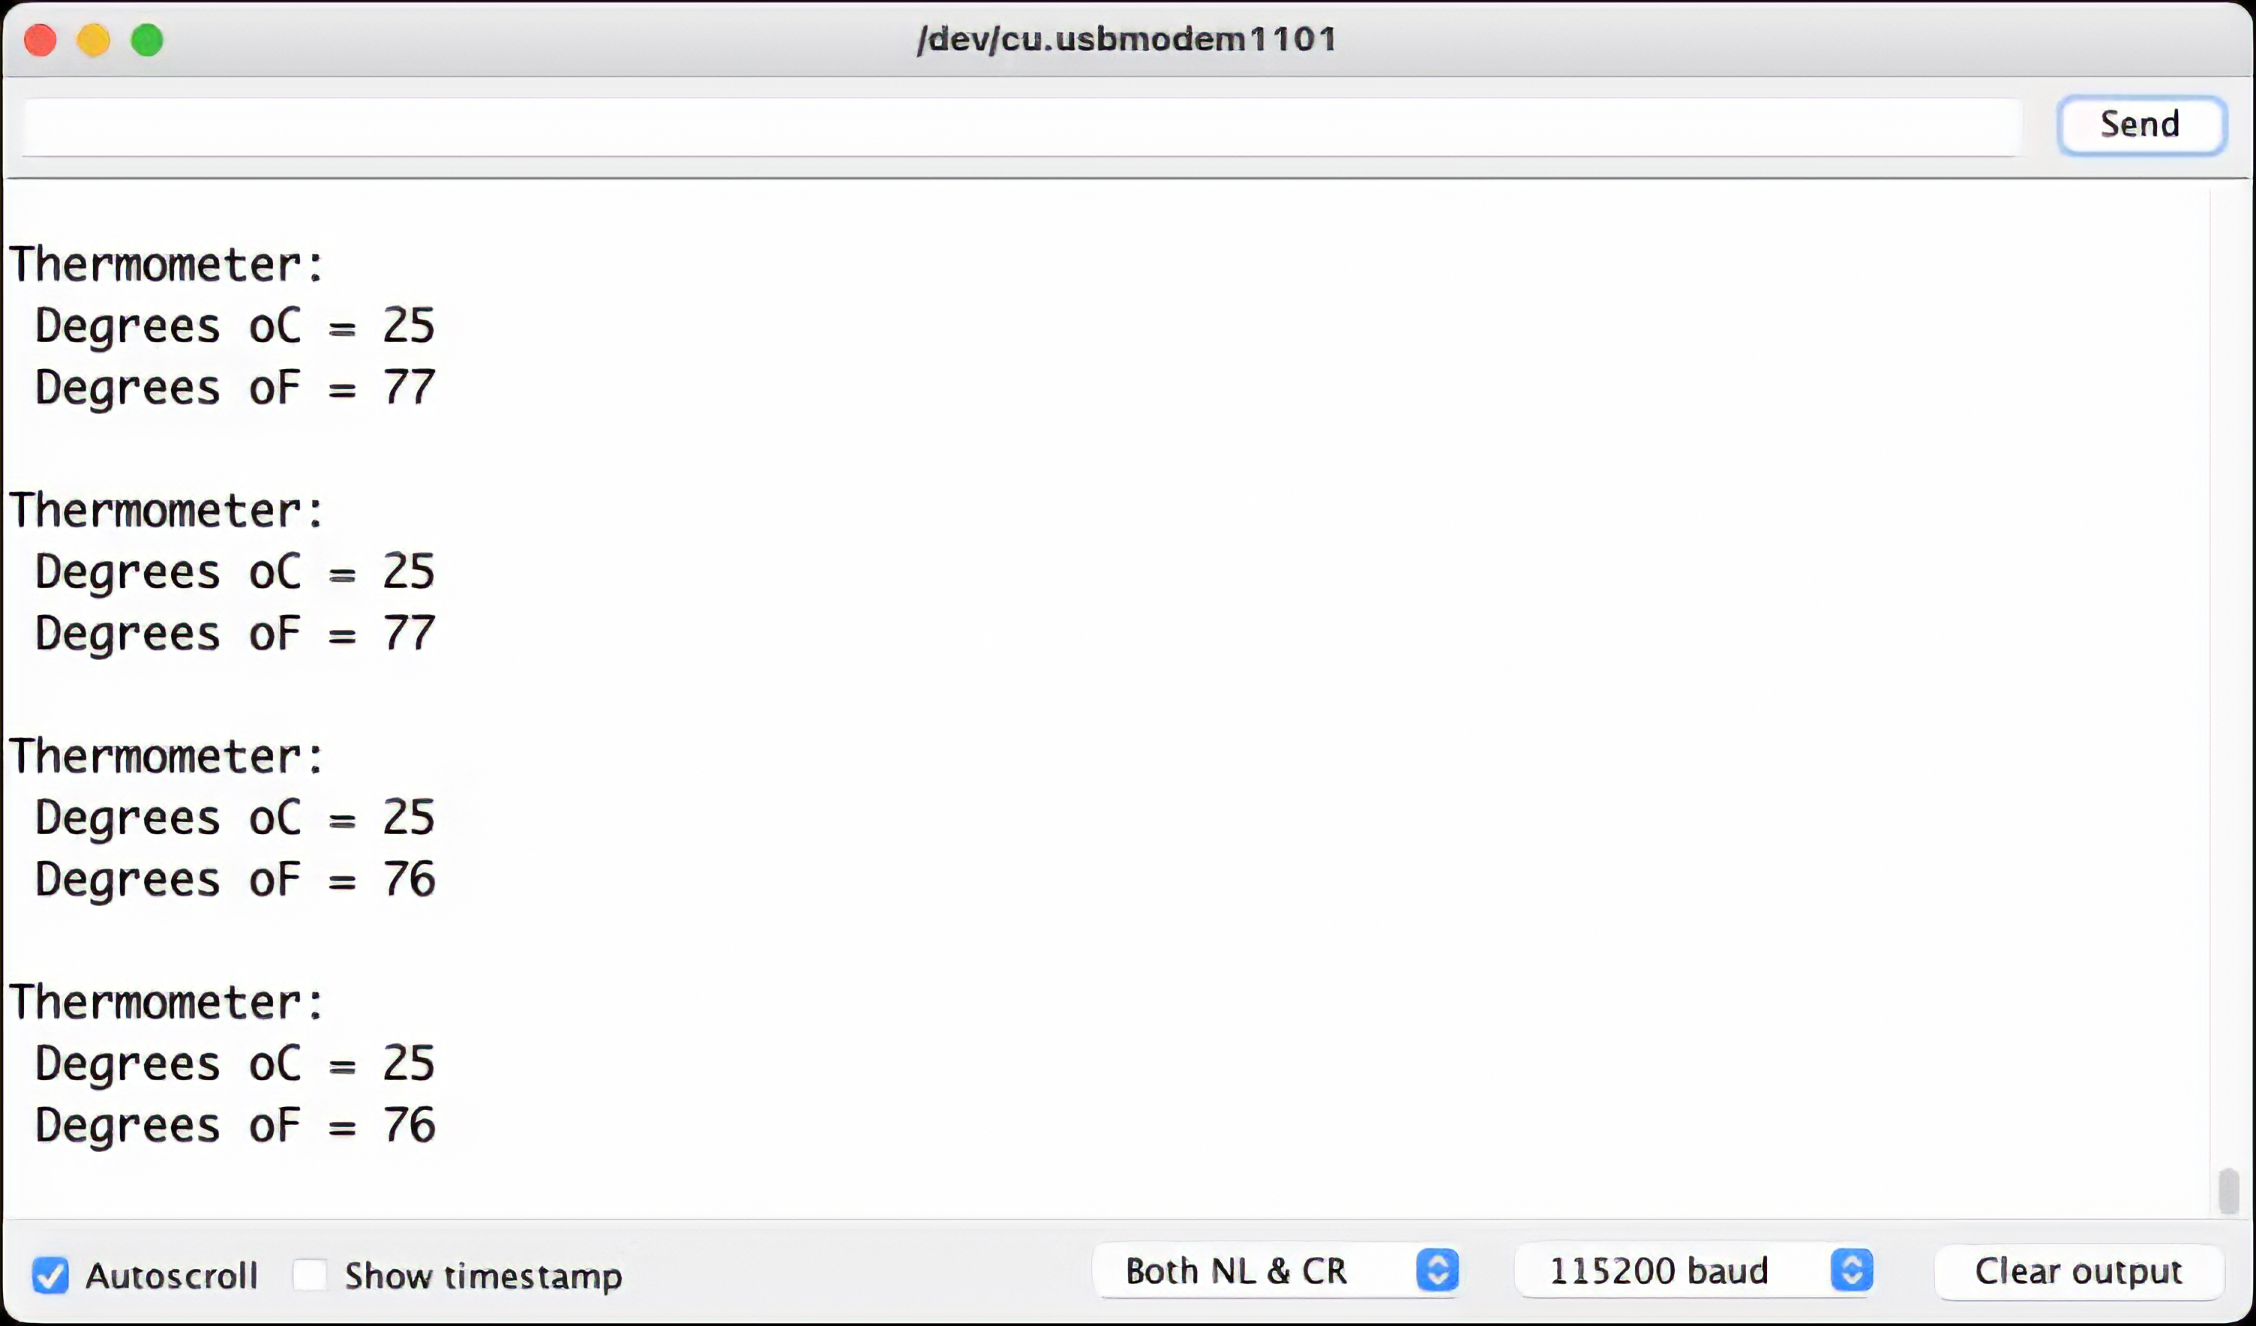
- **t**: Temperature (see the result on Serial Monitor)
The following images show the result:
<!--  -->
<!--  -->
<!--  -->
## 4.2.4 The TinyML Motion Classification Model
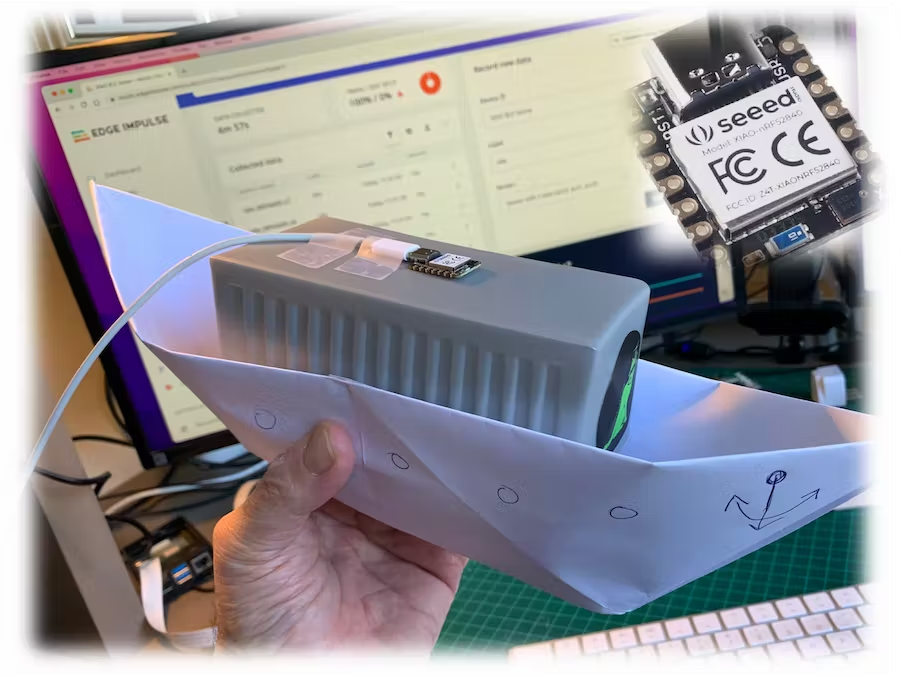
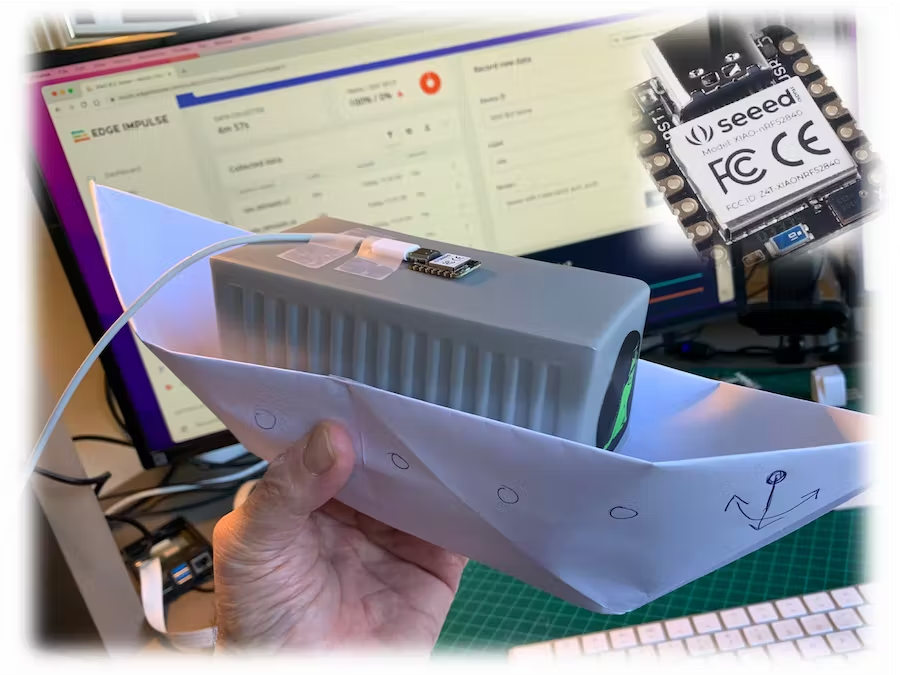
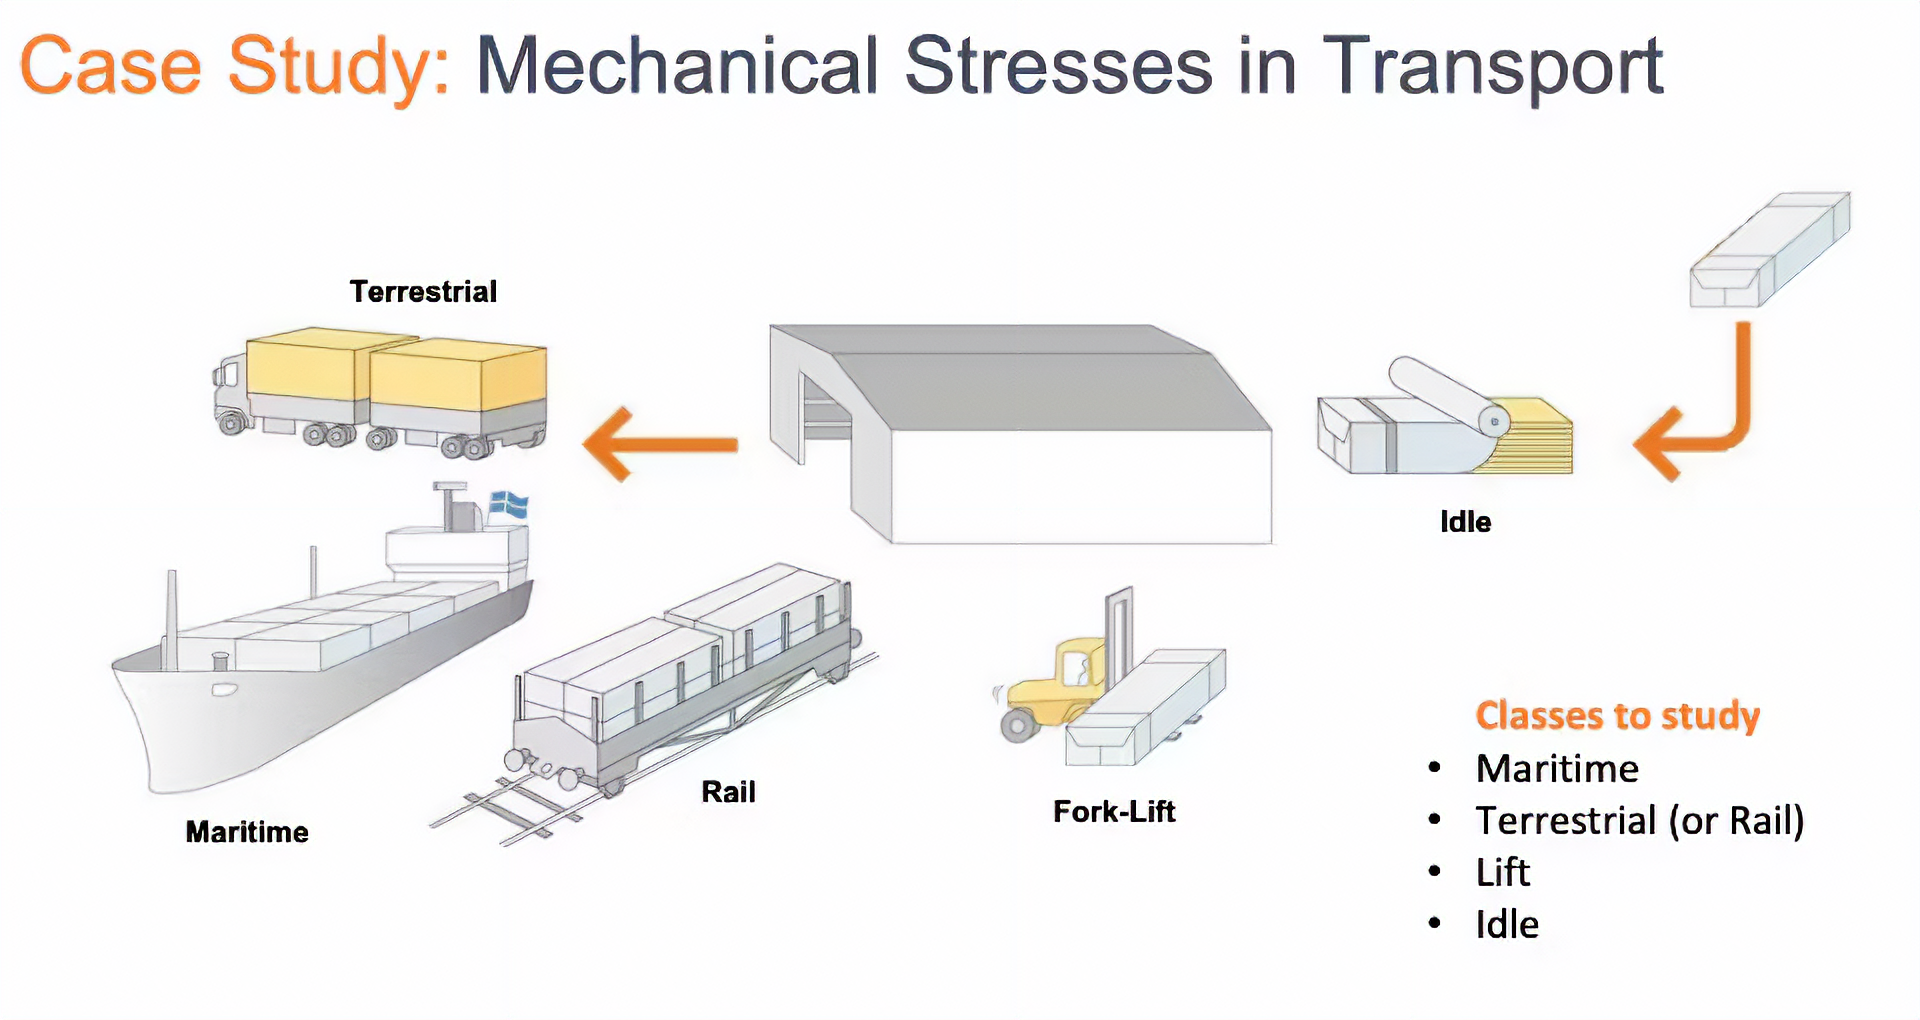
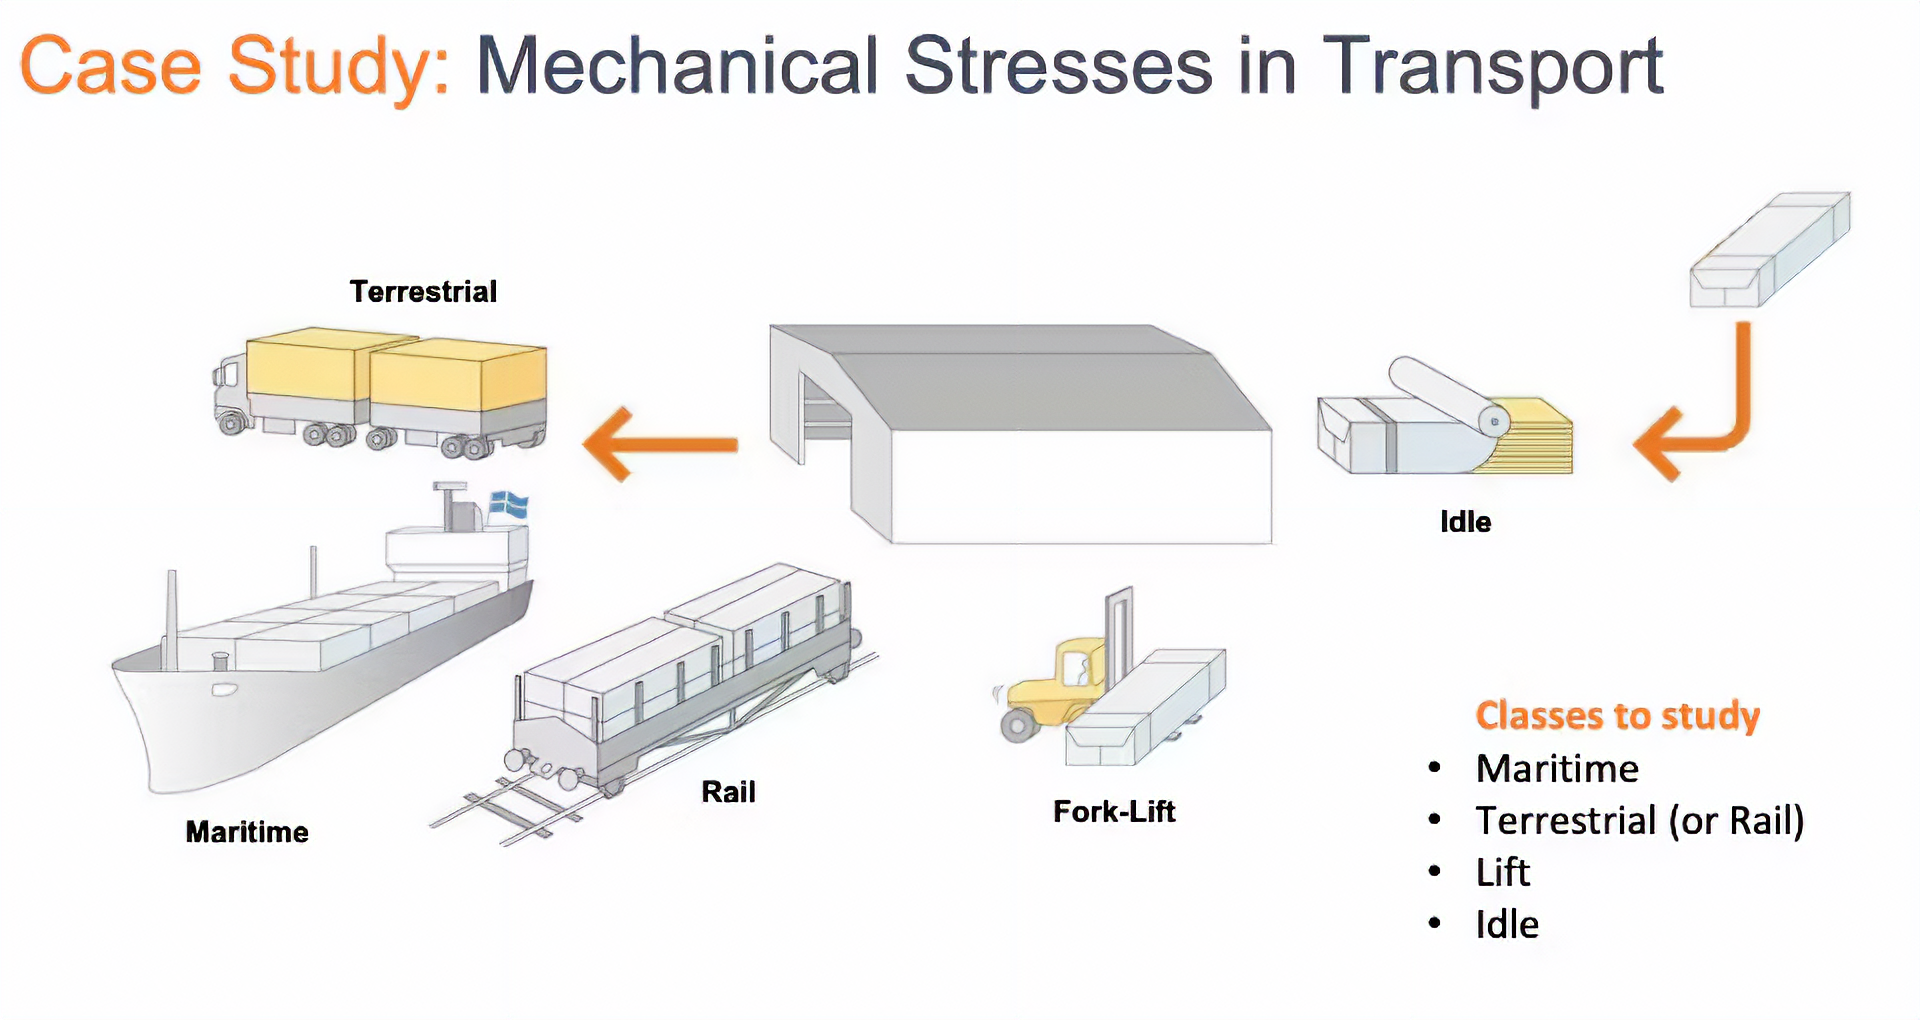
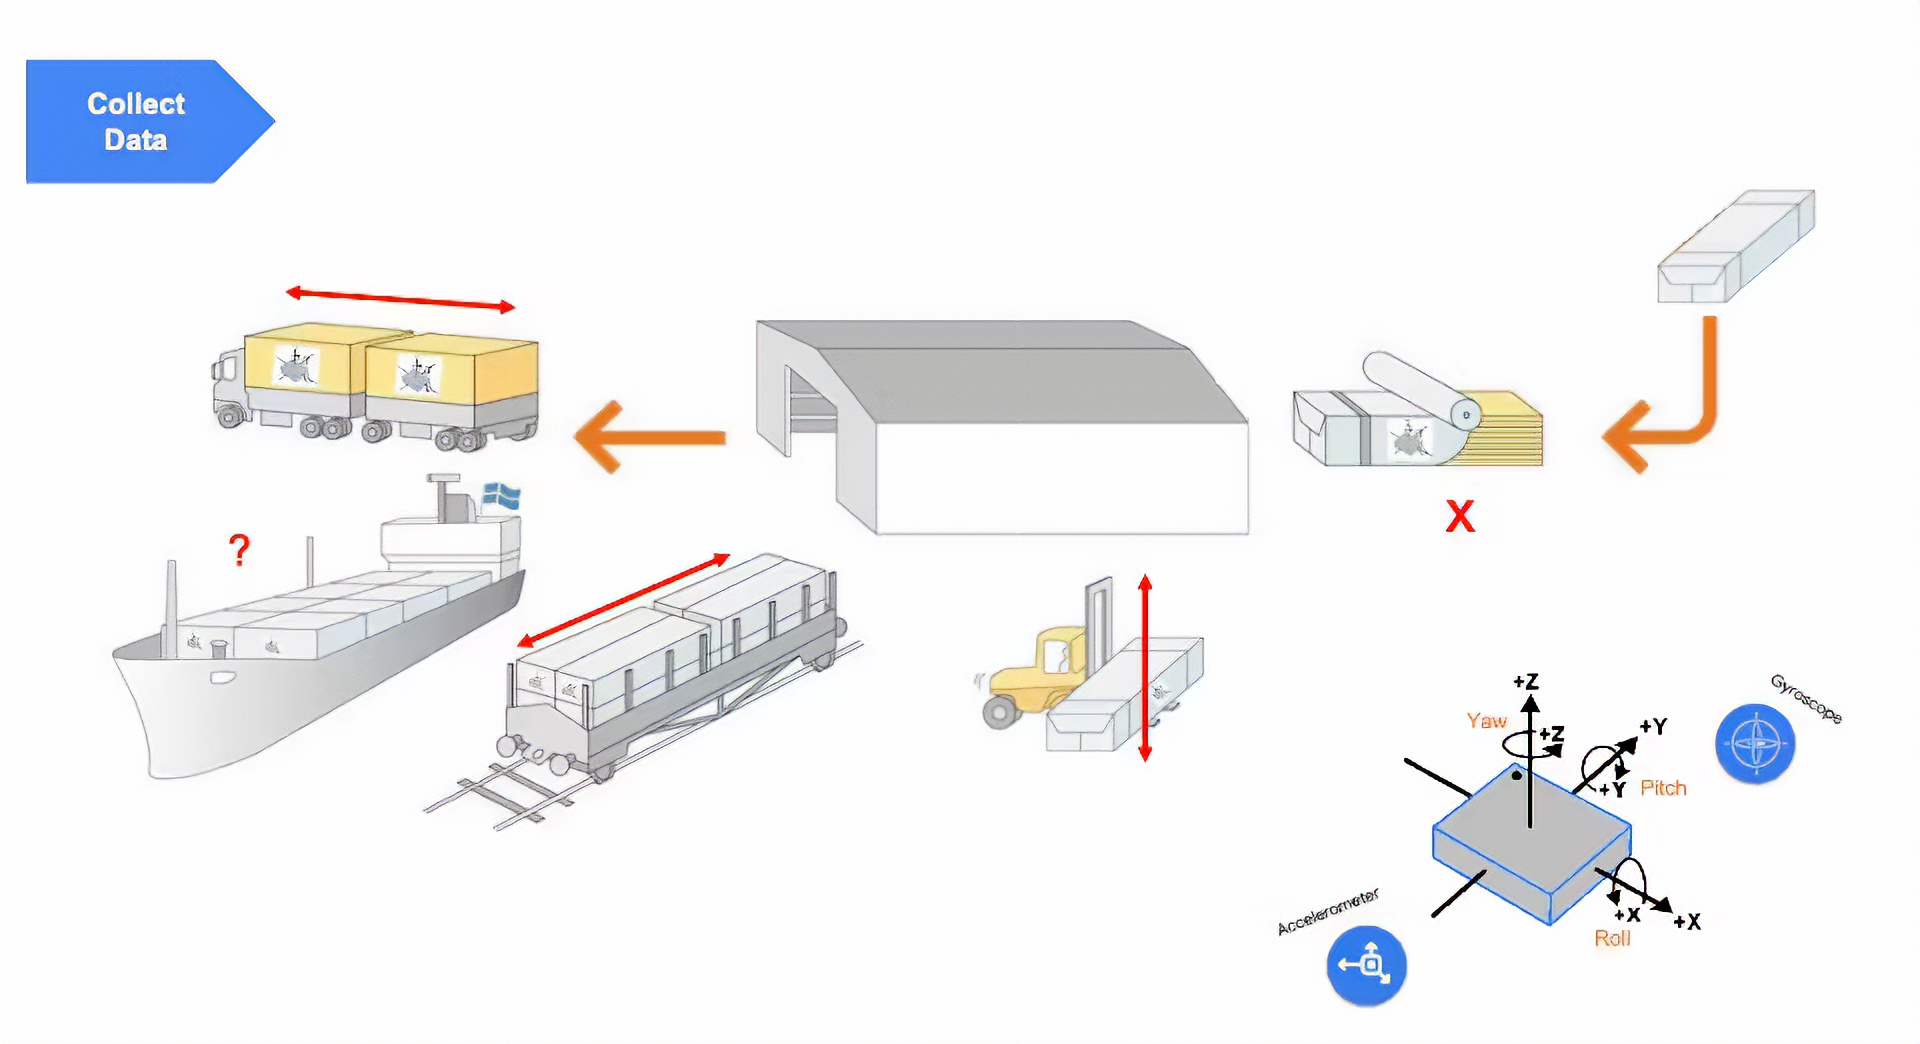
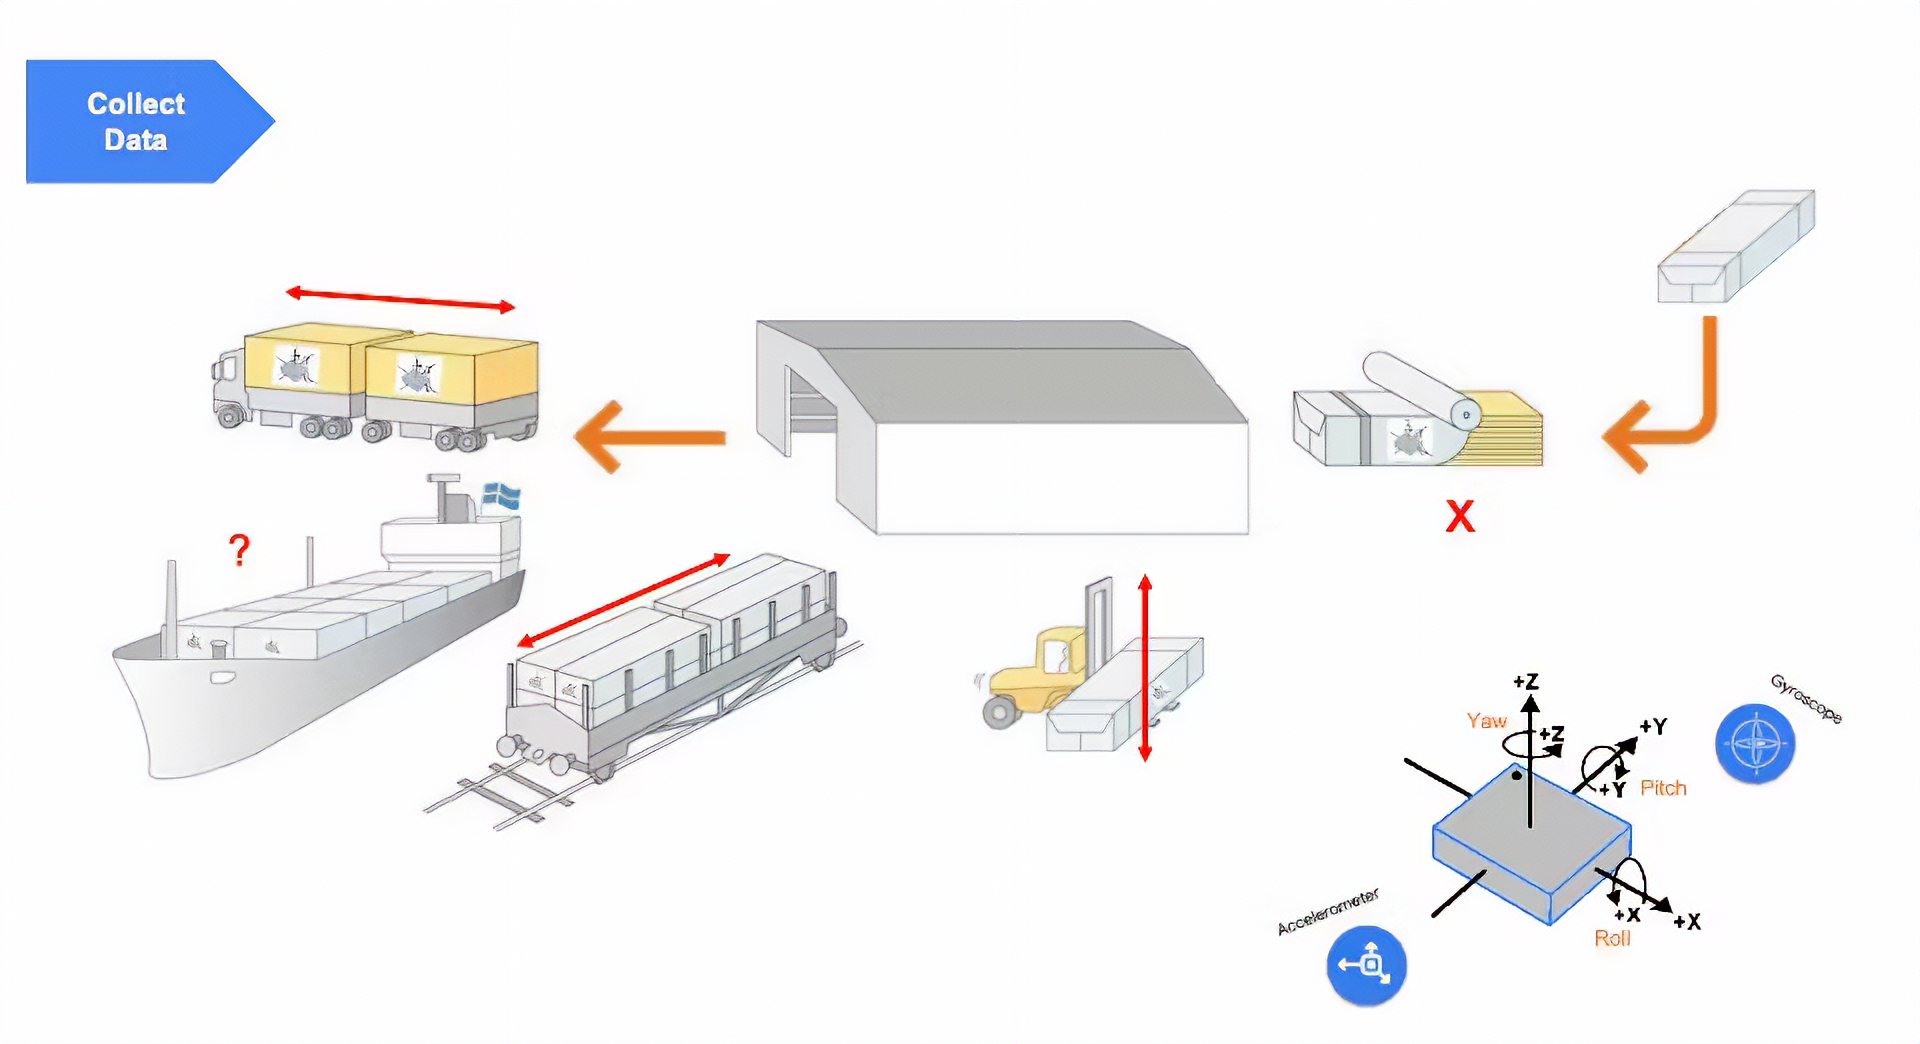
For our project, we will simulate mechanical stresses in transport. Our problem will be to classify four classes of movement:
- **Maritime** (pallets in boats)
- **Terrestrial** (palettes in a Truck or Train)
- **Lift** (Palettes being handled by Fork-Lift)
- **Idle** (Palettes in Storage houses)
<!--  -->
So, to start, we should collect data. Then, accelerometers will provide the data on the palette (or container).
<!--  -->
<!--  -->

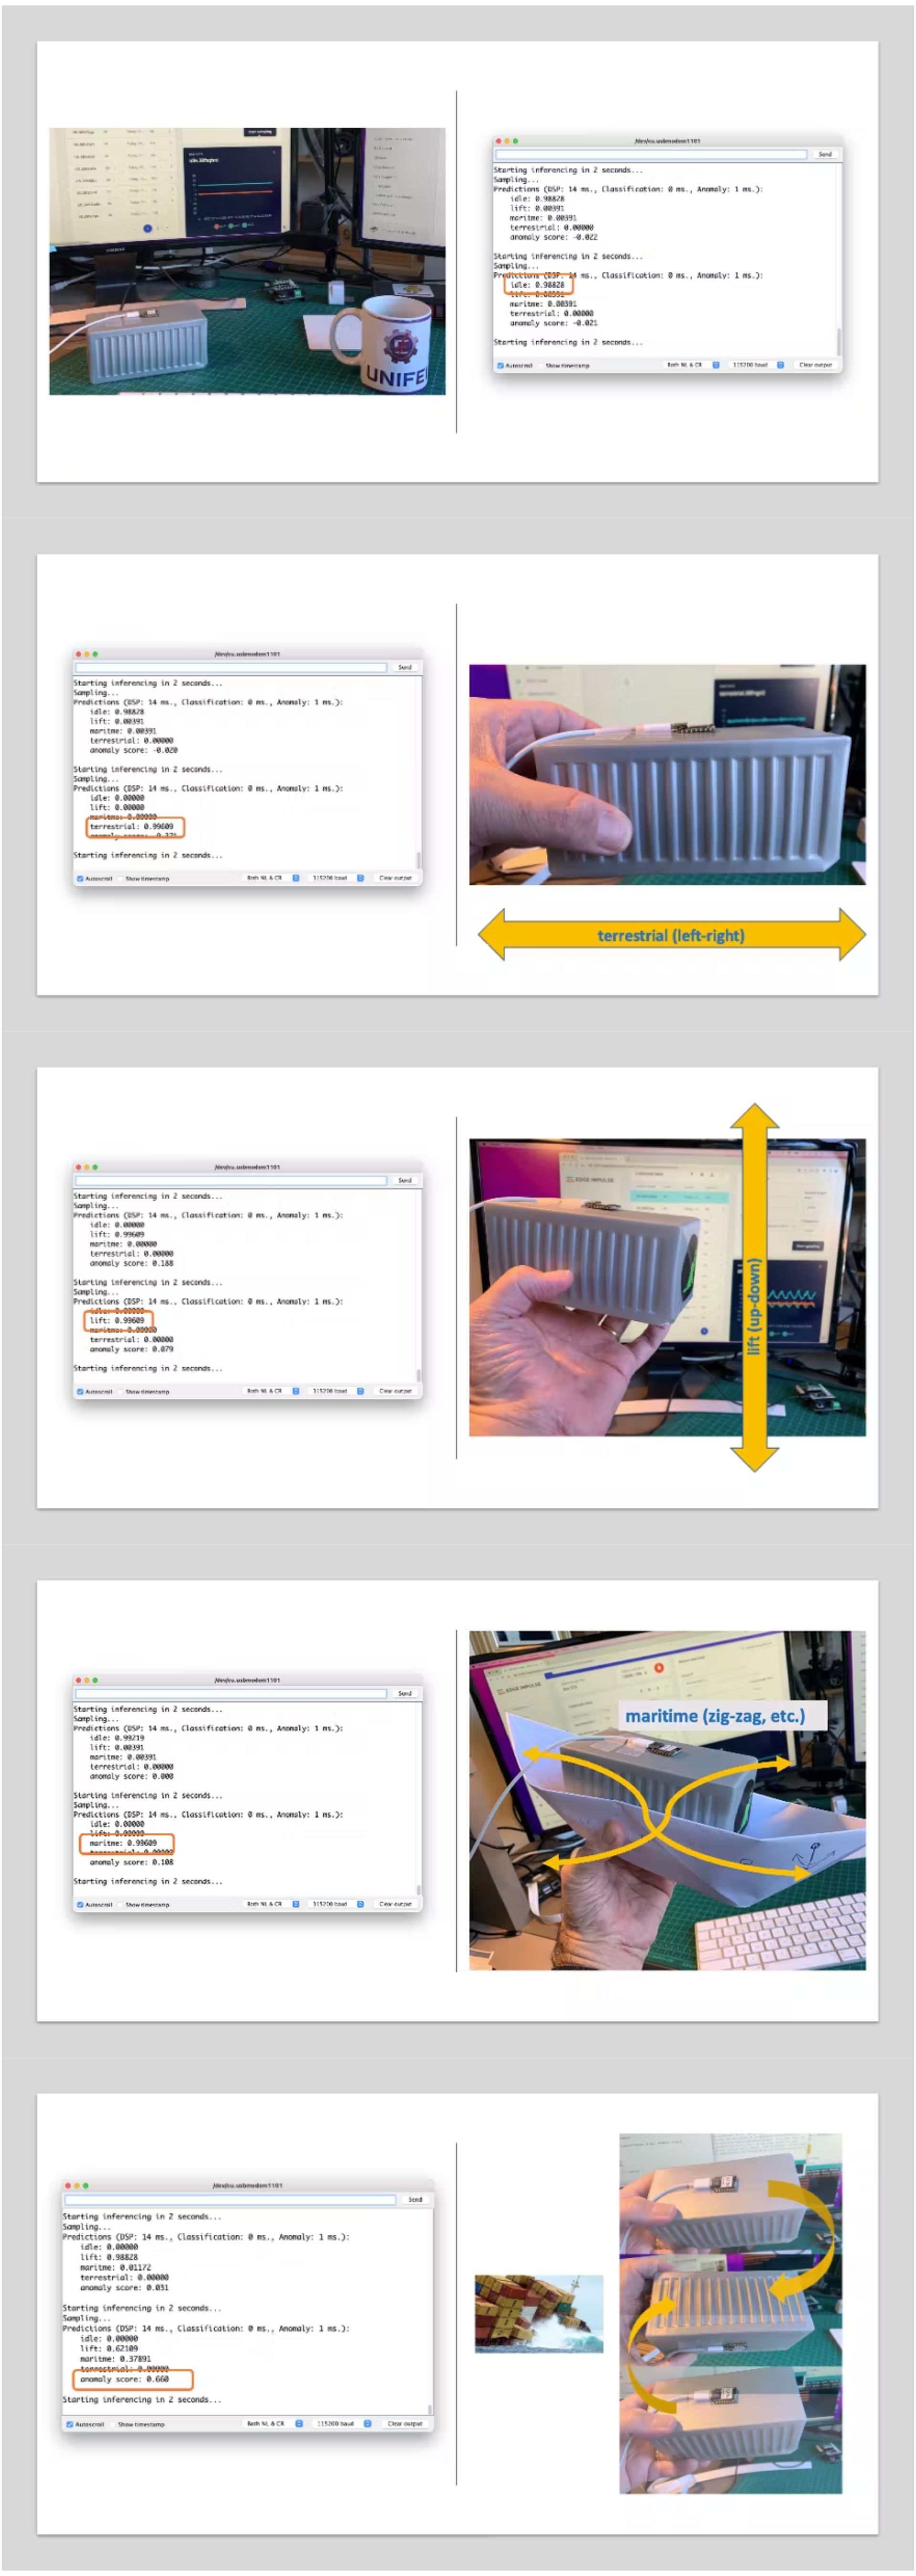
From the above images, we can see that primarily horizontal movements should be associated with "Terrestrial class," Vertical movements to "Lift Class," no activity to "Idle class," and movent on all three axes to [Maritime class](https://www.containerhandbuch.de/chb_e/stra/index.html?/chb_e/stra/stra_02_03_03.htm).
### 4.2.4.1 Connecting a Device to the Edge Impulse Studio
For data collection, we can have several options. In a real case, we can have our device, for example, connected directly to one container, and the data collected on a file (for example .CSV) and stored on an SD card (via SPI connection) or an offline repo in your computer. Data can also be sent remotely to a nearby repository, such as a mobile phone, using Bluetooth as done in this project: [Sensor DataLogger](https://www.hackster.io/mjrobot/sensor-datalogger-50e44d). Once your dataset is collected and stored as a .CSV file, it can be uploaded to the Studio using the [CSV Wizard tool](https://docs.edgeimpulse.com/docs/edge-impulse-studio/data-acquisition/csv-wizard).
> In this [video](https://youtu.be/2KBPq_826WM), you can learn alternative ways to send data to the Edge Impulse Studio.
In this project, we should first connect our device to the Edge Impulse Studio for data collection, which will also be used for data pre-processing, model training, testing, and deployment.
> Follow the instructions [here](https://docs.edgeimpulse.com/docs/edge-impulse-cli/cli-installation) to install the [Node.js](https://nodejs.org/en/) and Edge Impulse CLI on your computer.
Once the XIAO nRF52840 Sense is not a fully supported development board by Edge Impulse, we should use the [CLI Data Forwarder](https://docs.edgeimpulse.com/docs/edge-impulse-cli/cli-data-forwarder) to capture data from the accelerometer and send it to the Studio, as shown in this diagram:
<!-- 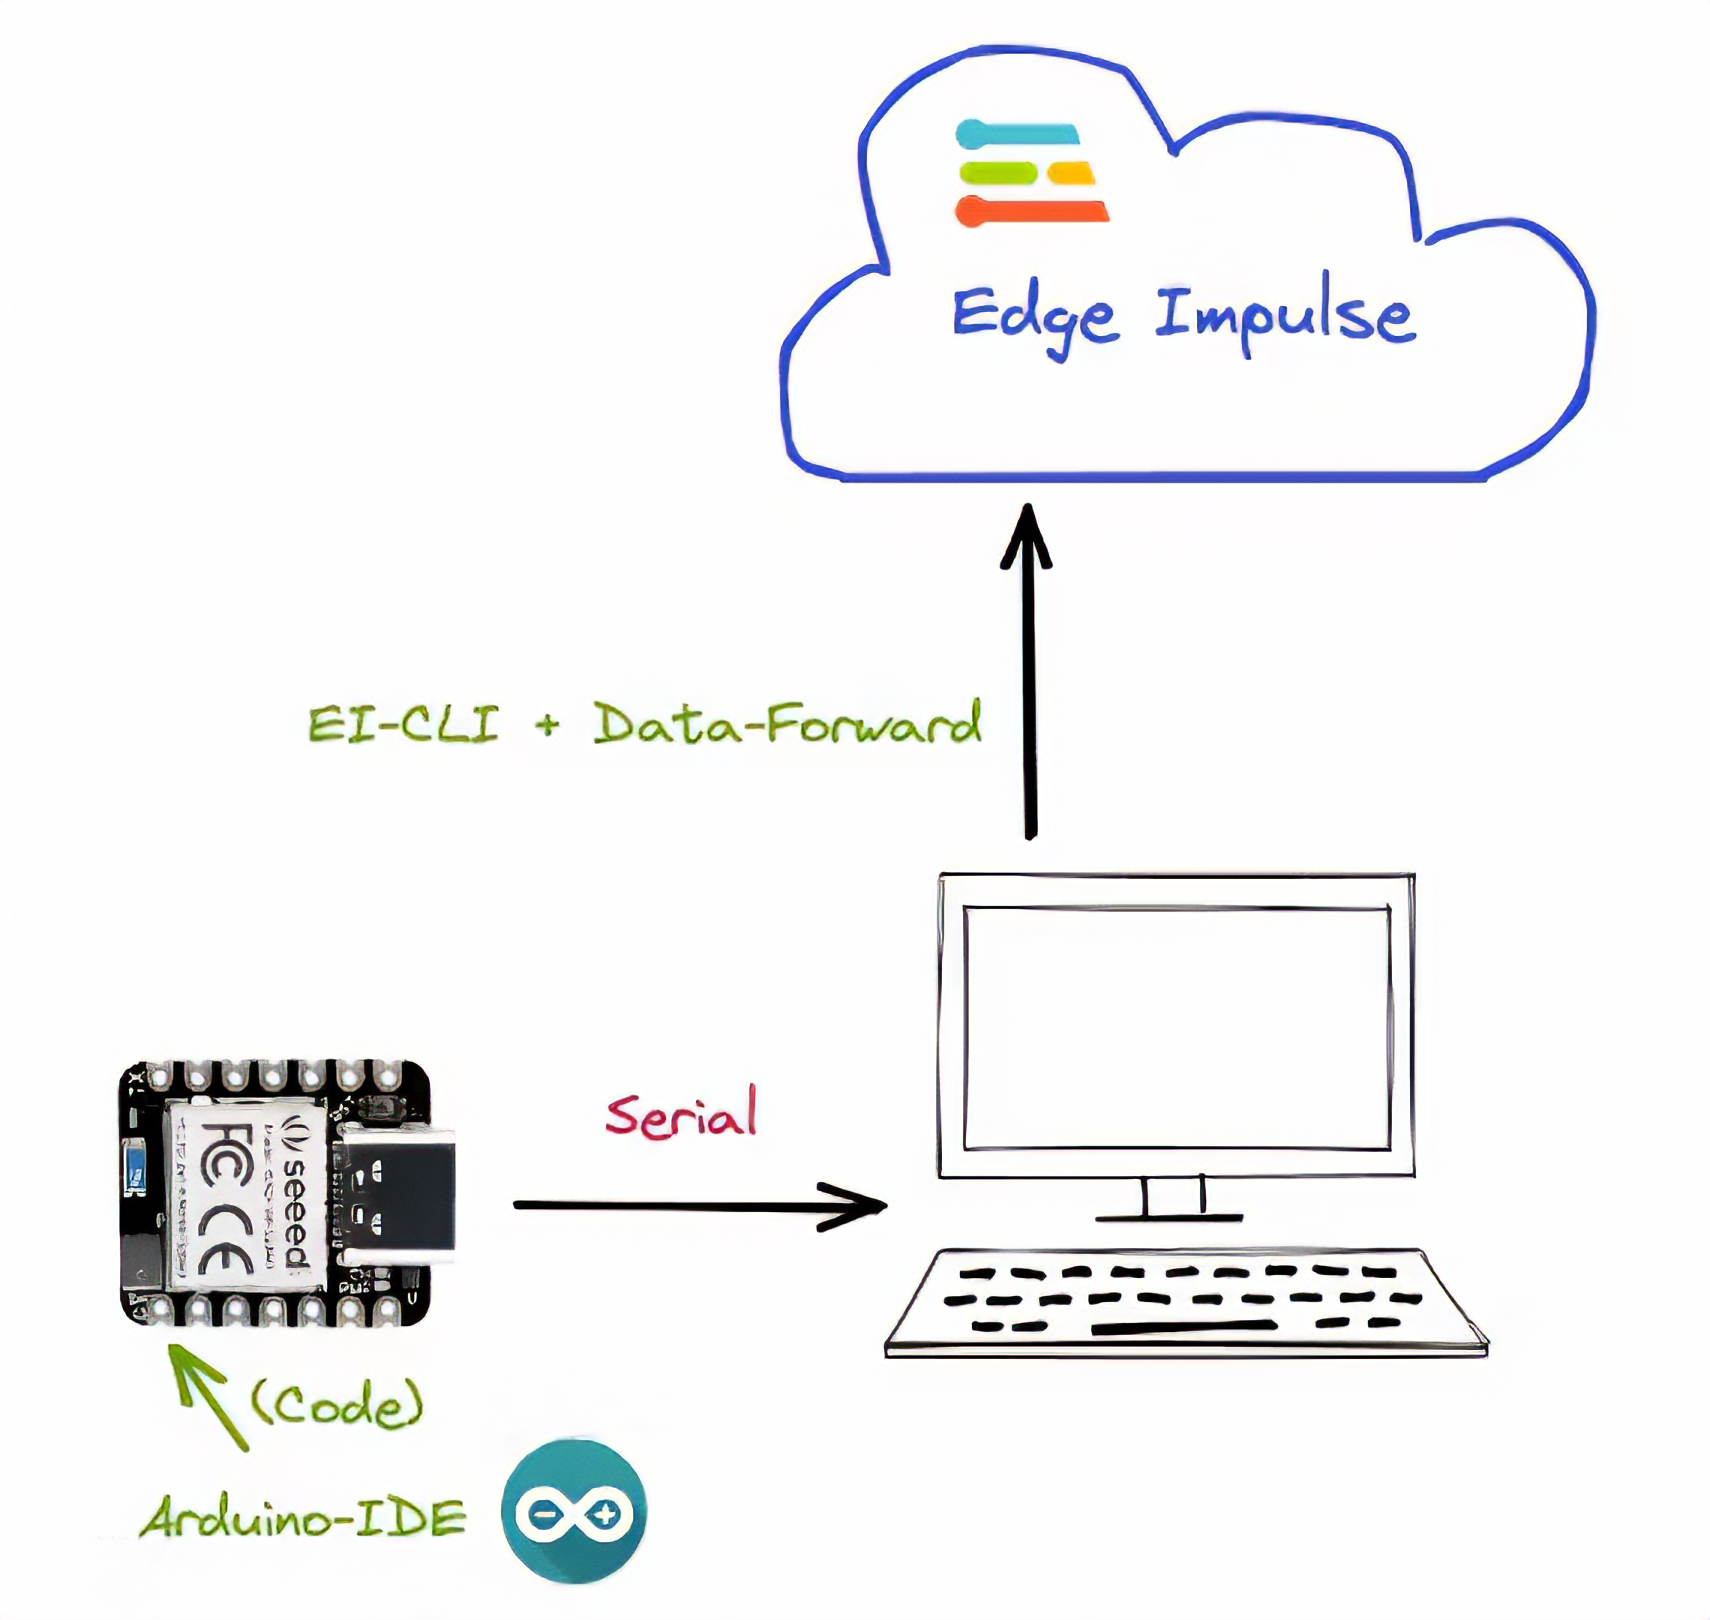 -->
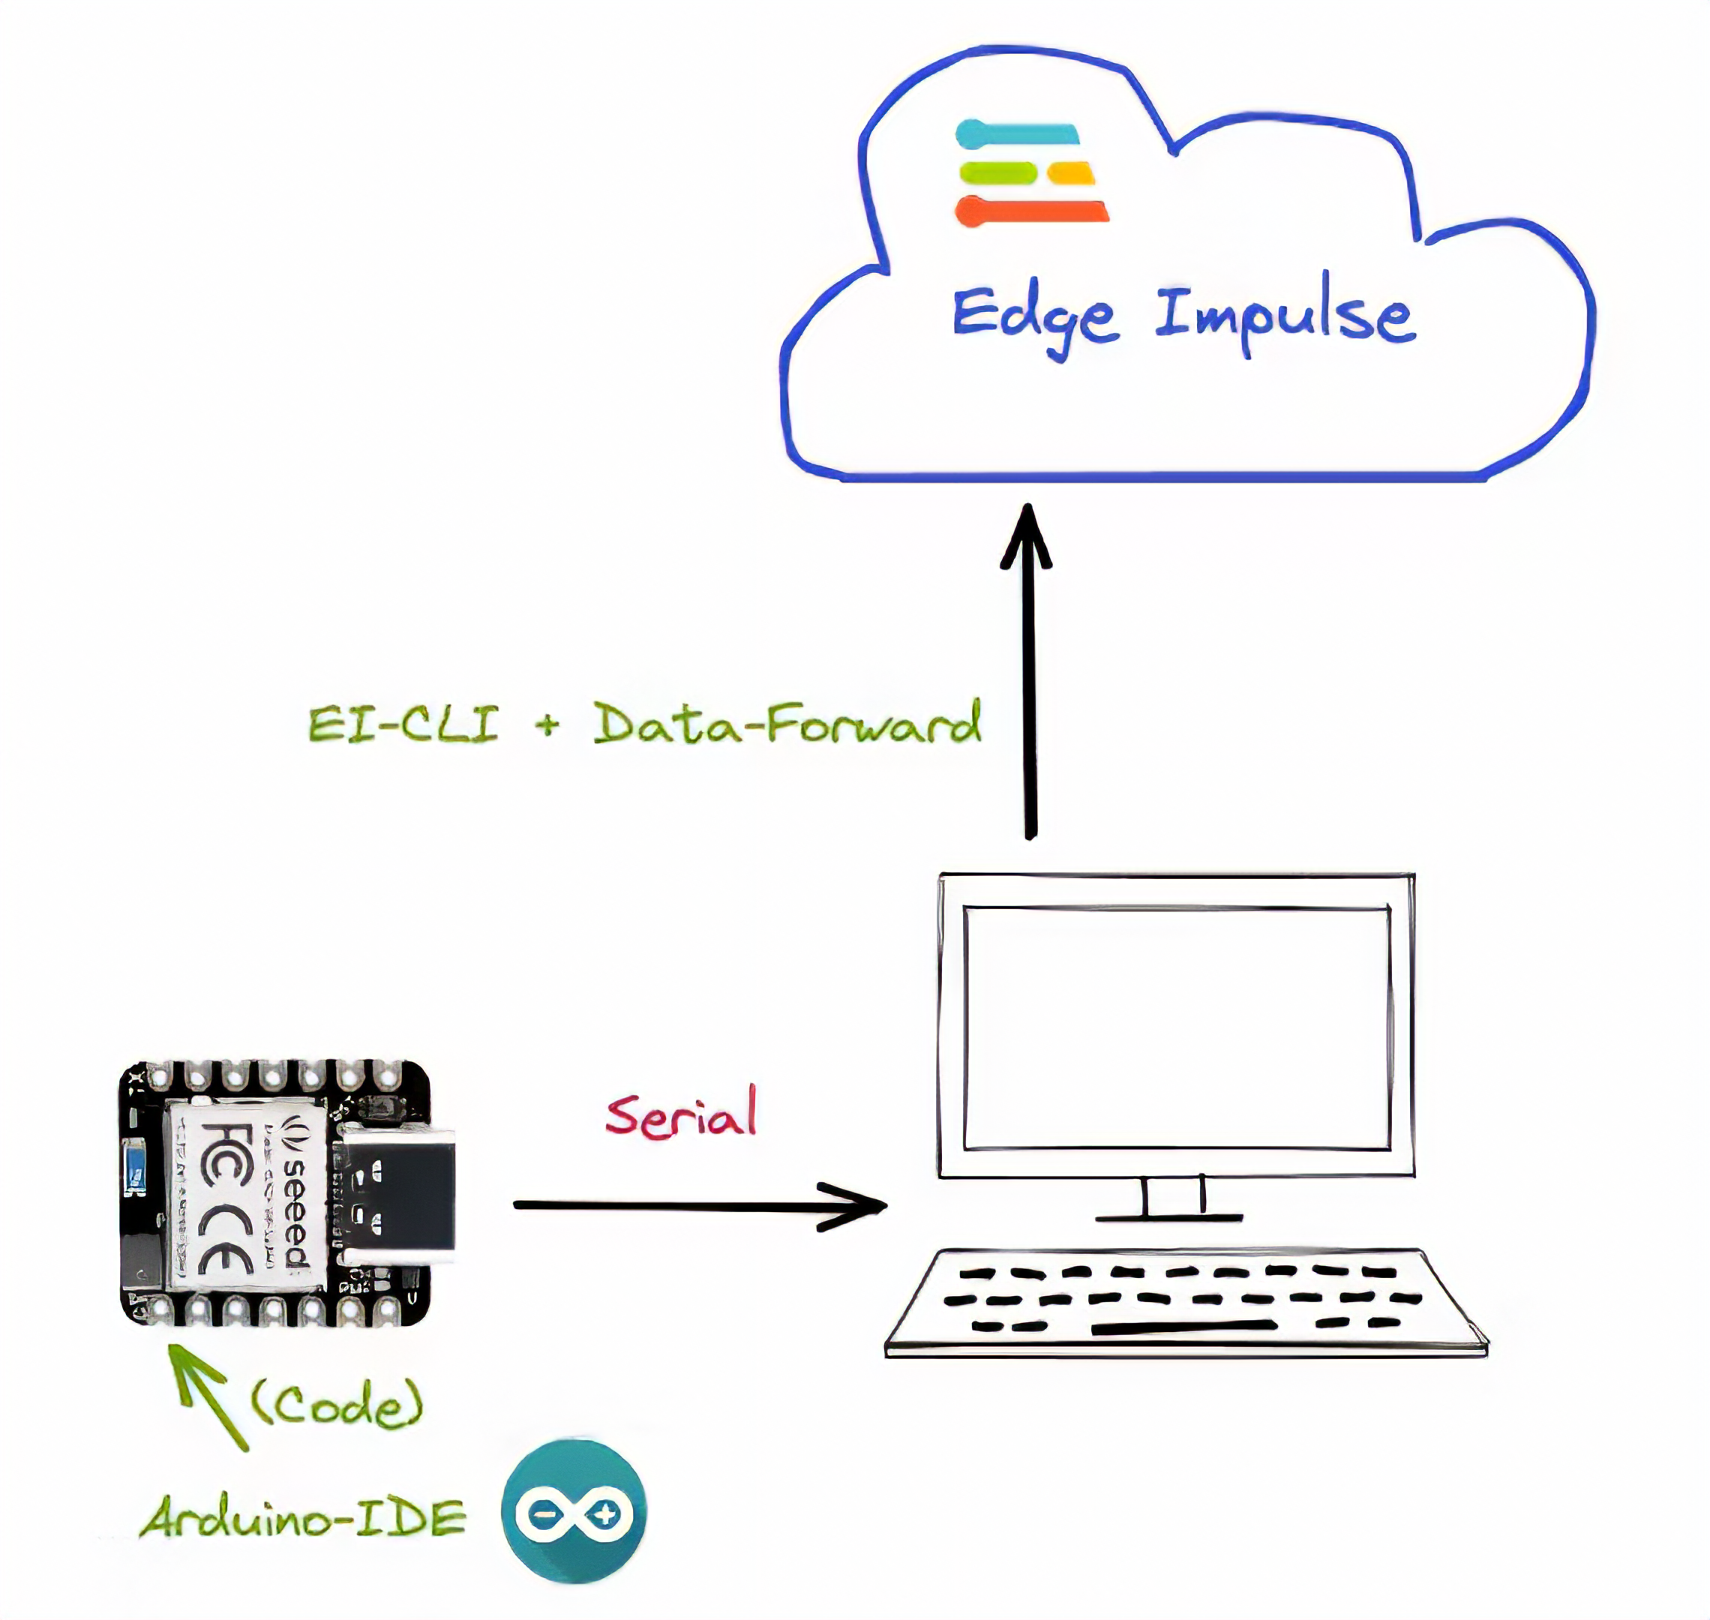
Your device should be connected to the computer serial and running a code to capture IMU (Accelerometer) data and "print them" on the serial. Further, the Edge Impulse Studio will "capture" them. Run the code below:
``` cpp
#include "LSM6DS3.h"
#include "Wire.h"
//Create an instance of class LSM6DS3
LSM6DS3 xIMU(I2C_MODE, 0x6A); //I2C device address 0x6A
#define CONVERT_G_TO_MS2 9.80665f
#define FREQUENCY_HZ 50
#define INTERVAL_MS (1000 / (FREQUENCY_HZ + 1))
static unsigned long last_interval_ms = 0;
void setup() {
Serial.begin(115200);
while (!Serial);
// configure the IMU
if (xIMU.begin() != 0) {
Serial.println("Device error");
} else {
Serial.println("Device OK!");
}
Serial.println("Data Forwarder - Built-in IMU (Accelerometer) on the XIAO BLE Sense\n");
}
void loop() {
float x, y, z;
if (millis() > last_interval_ms + INTERVAL_MS) {
last_interval_ms = millis();
x = xIMU.readFloatAccelX();
y = xIMU.readFloatAccelY();
z = xIMU.readFloatAccelZ();
Serial.print(x * CONVERT_G_TO_MS2);
Serial.print('\t');
Serial.print(y * CONVERT_G_TO_MS2);
Serial.print('\t');
Serial.println(z * CONVERT_G_TO_MS2);
}
}
```
> Get this code online 🔗 <br />
> <https://github.com/Mjrovai/Seeed-XIAO-BLE-Sense/blob/main/XIAO_BLE_Sense_Accelerometer_Data_Forewarder/XIAO_BLE_Sense_Accelerometer_Data_Forewarder.ino>
Go to the Edge Impulse page and create a project. Next, start the [CLI Data Forwarder](https://docs.edgeimpulse.com/docs/edge-impulse-cli/cli-data-forwarder) on your terminal, entering (if it is the first time) the following command:
<!-- the command below is not cpp, is shell -->
``` cpp
$ edge-impulse-data-forwarder --clean
```
Next, enter your EI credentials, and choose your project, variable, and device names:
<!-- 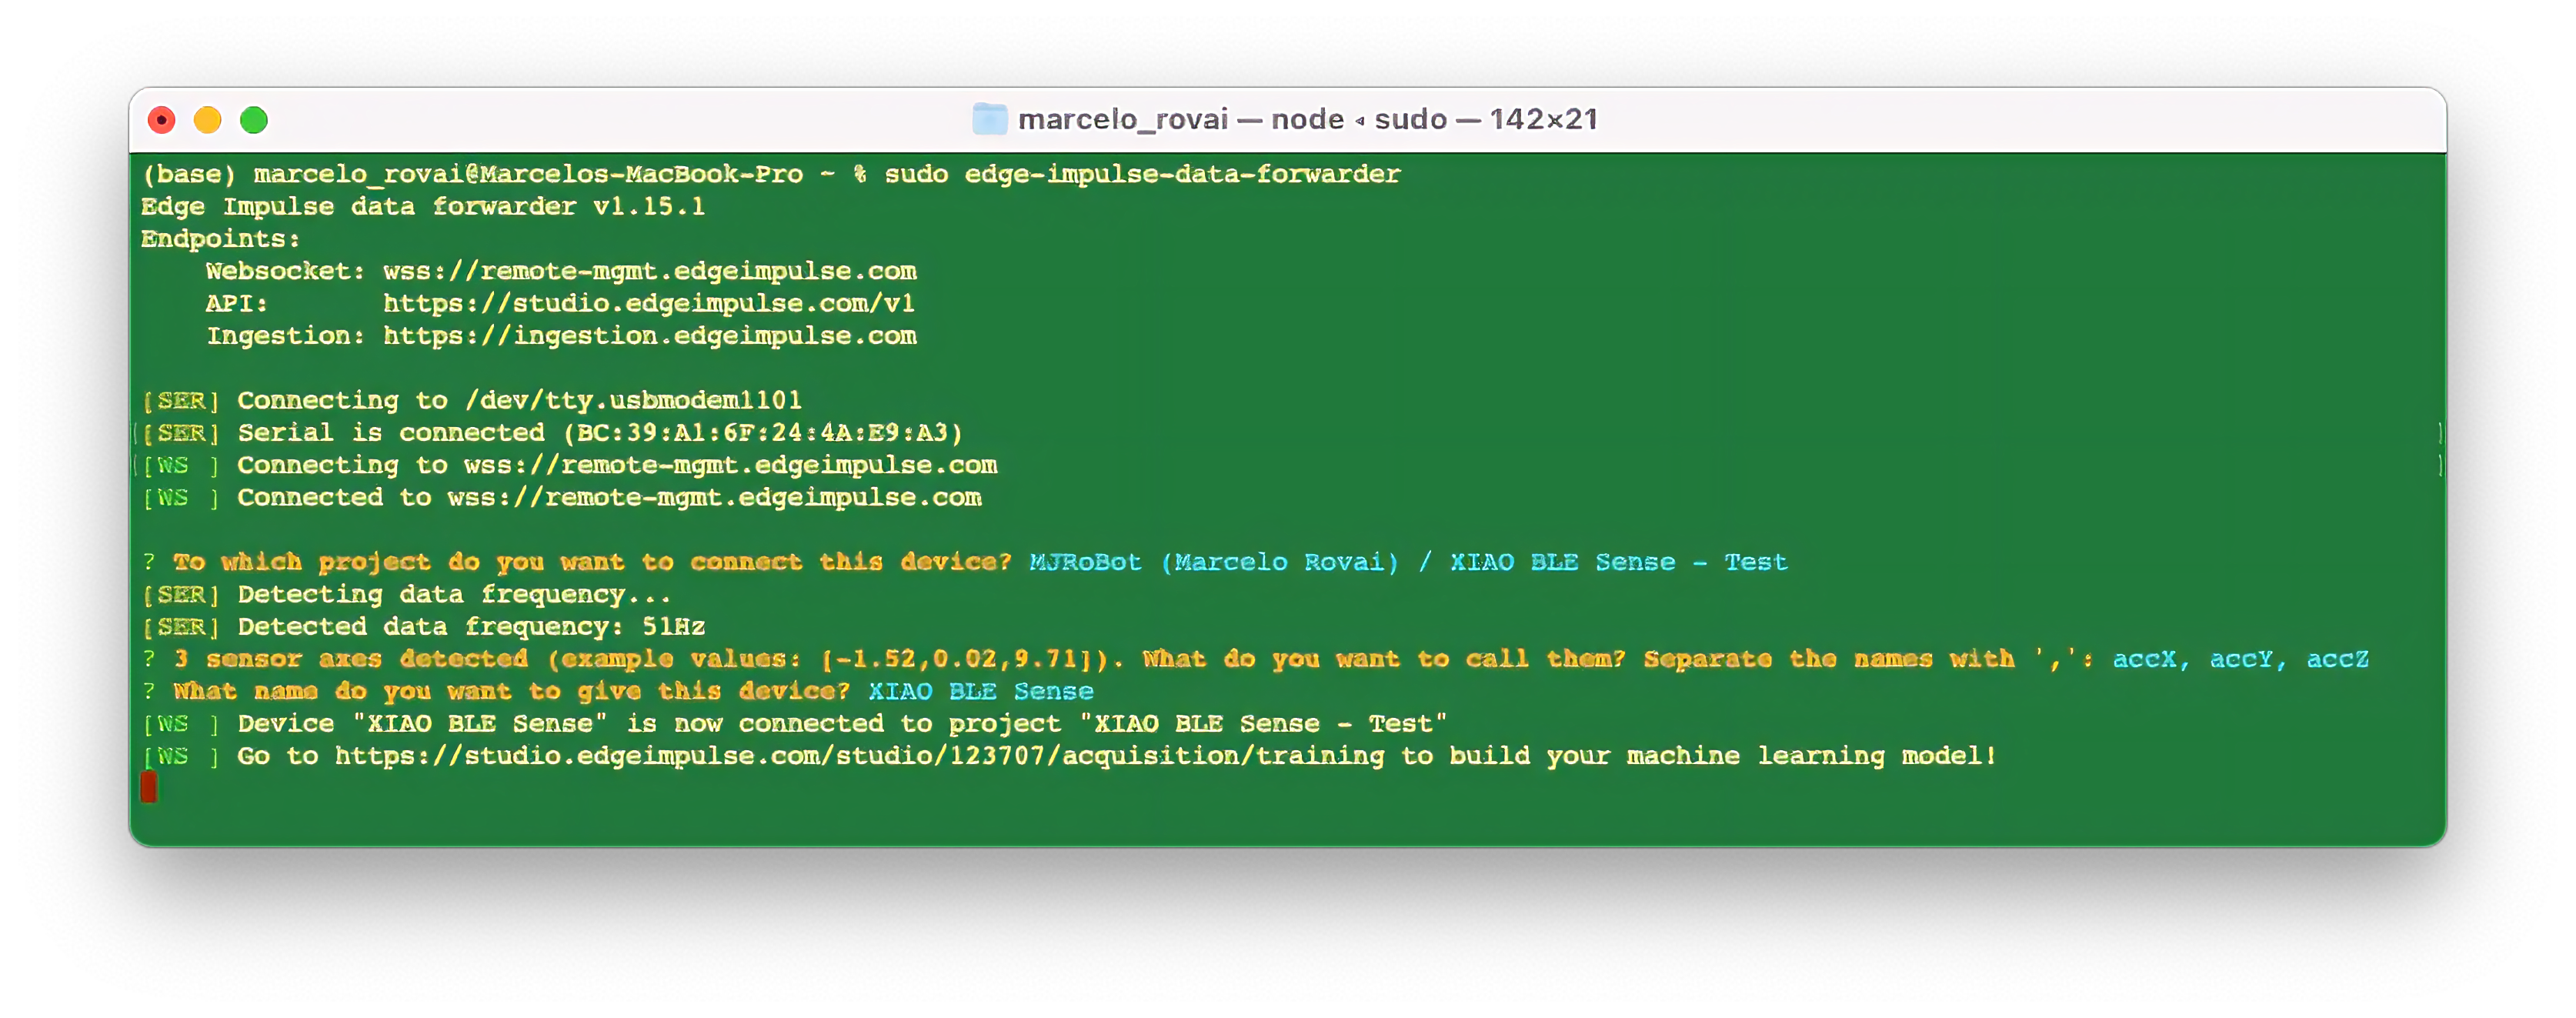 -->
> The Studio can read the sampled frequency as 51Hz instead of the 50Hz previously defined in the code. It is OK.
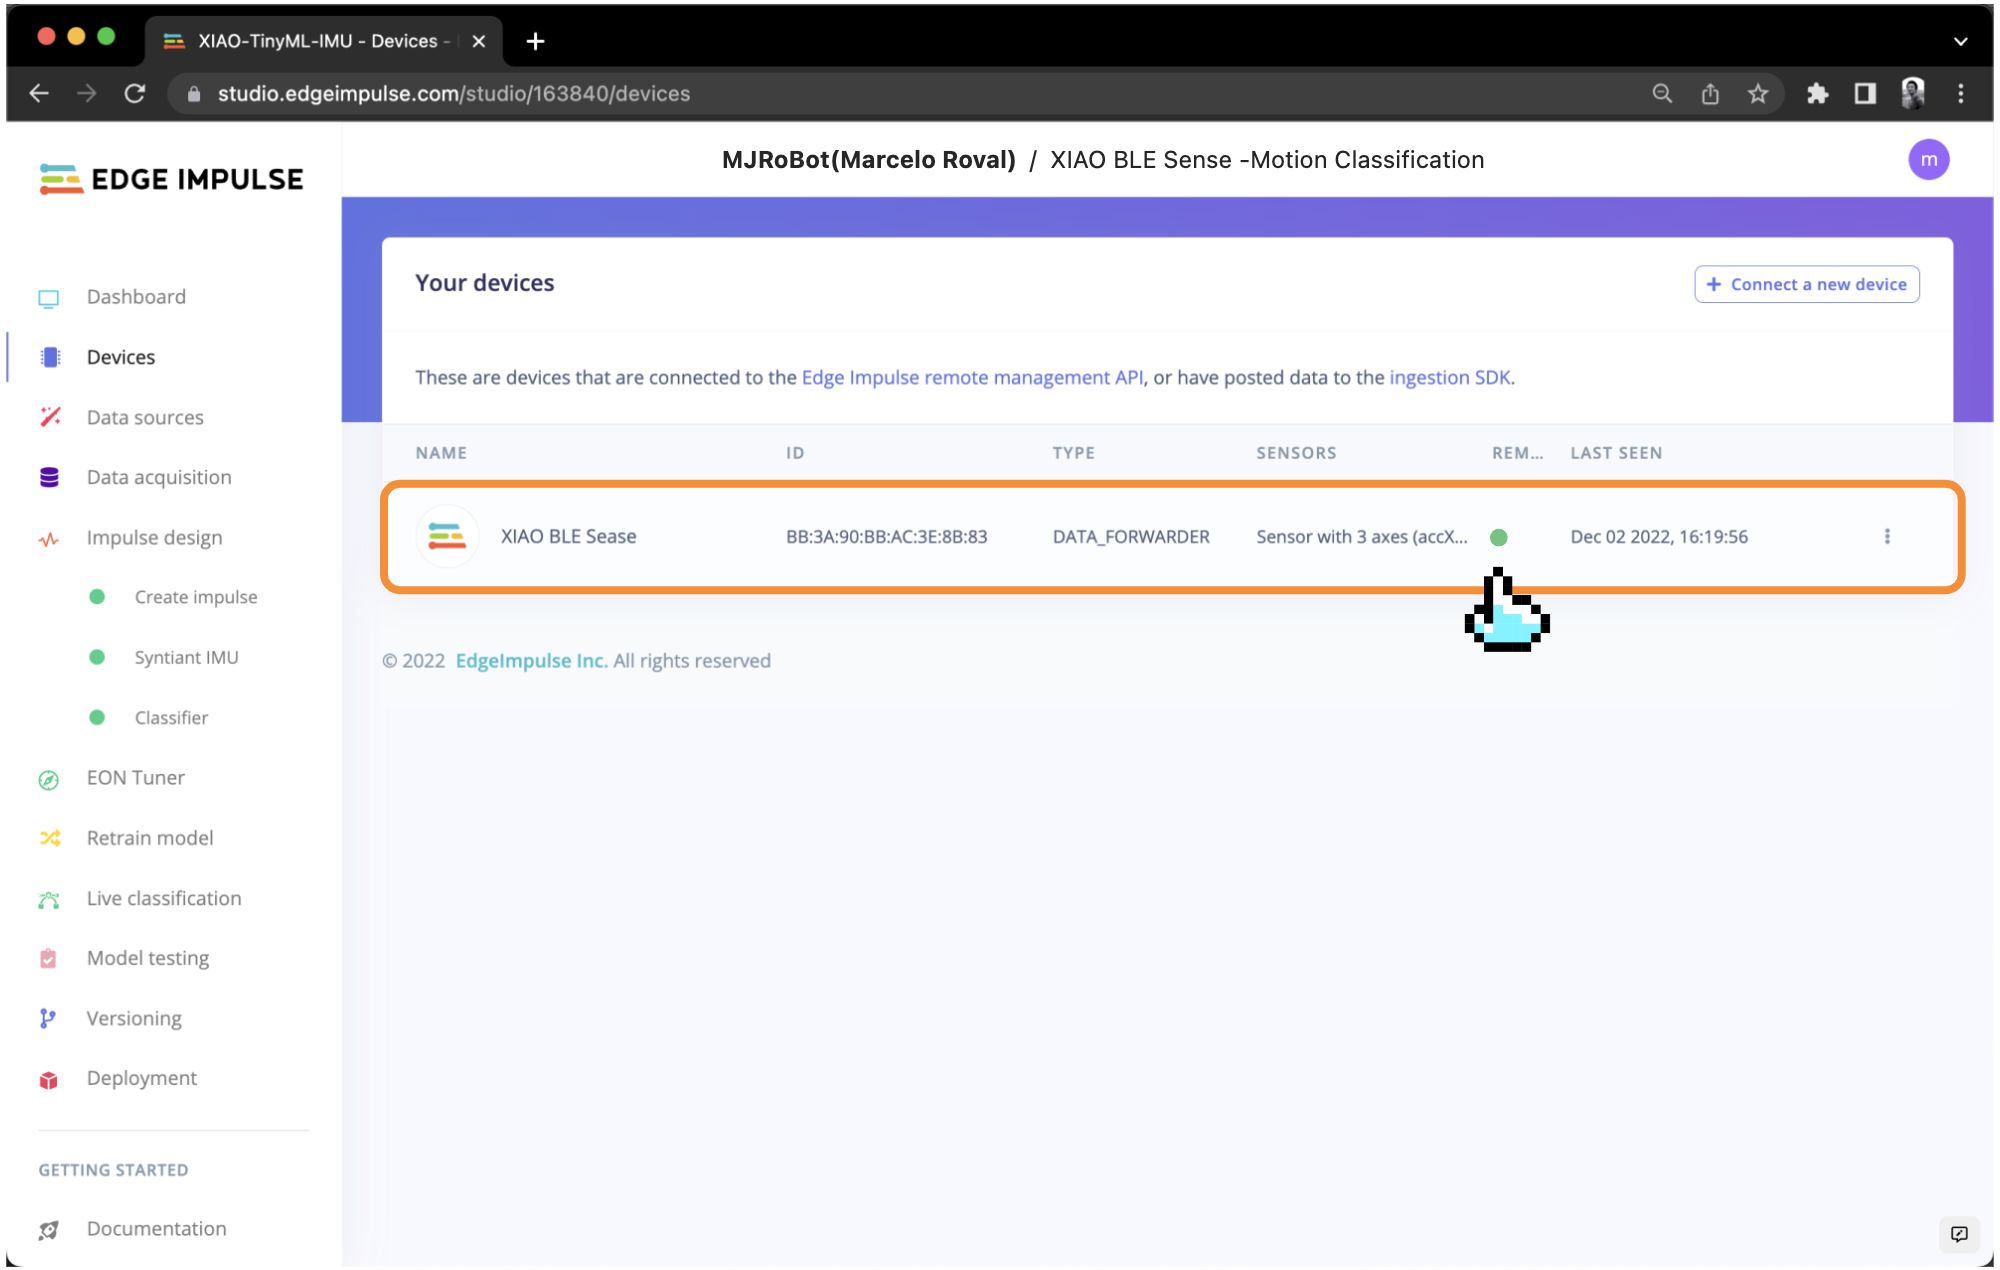
Go to the `Devices` section on your EI Project and verify if the device is connected (the dot should be green):
<!--  -->
### 4.2.4.2 Data Collection
As discussed before, we should capture data from all four Transportation Classes:
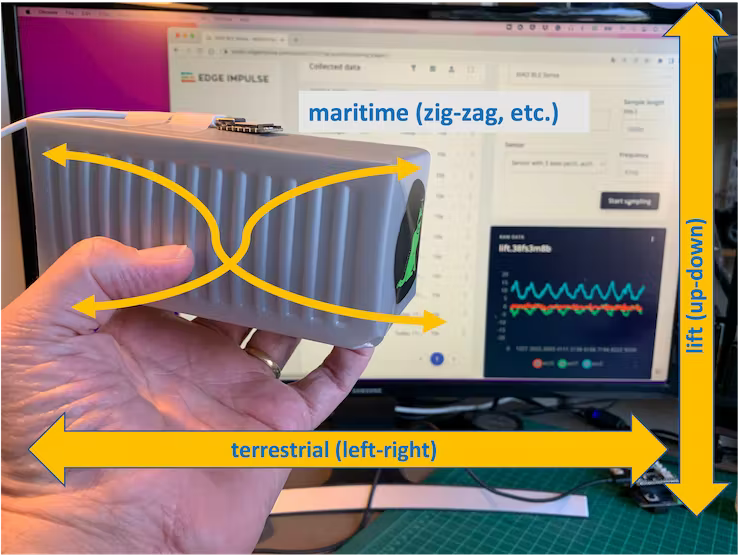
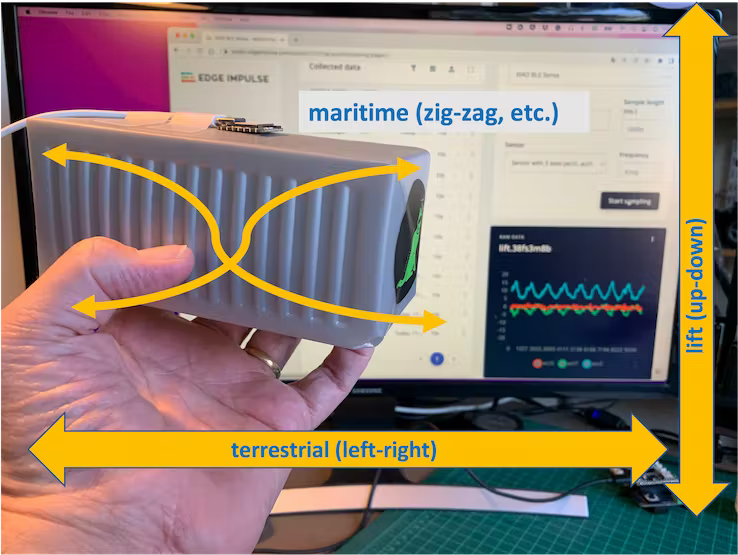
- **lift** (up-down)
- **terrestrial** (left-right)
- **maritime** (zig-zag, etc.)
- **idle**
<!--  -->
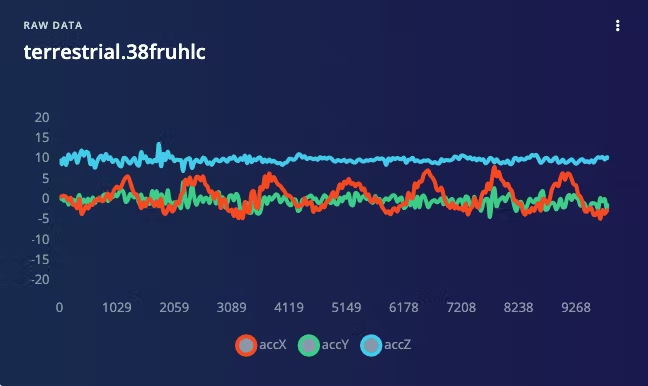
Below is one sample (10 seconds of raw data):
<!--  -->
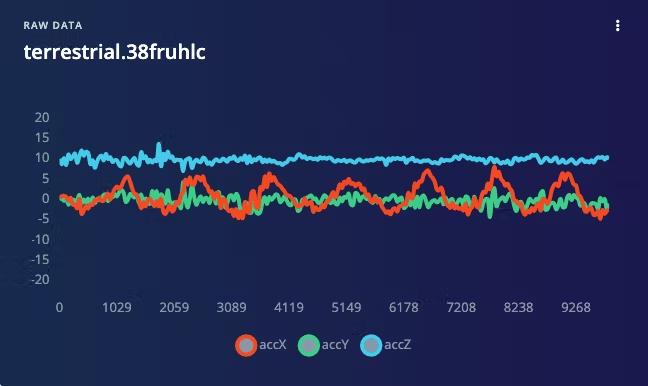
You can capture, for example, around 2 minutes (twelve samples of 10 seconds) for each of the four classes (a total of 8 minutes of data). Using the `three dots` menu after each one of the samples, select 2 of them, reserving them for the Test set. Alternatively, you can use the automatic `Train/Test Split tool` on the `Danger Zone` of `Dashboard` tab.
<!-- 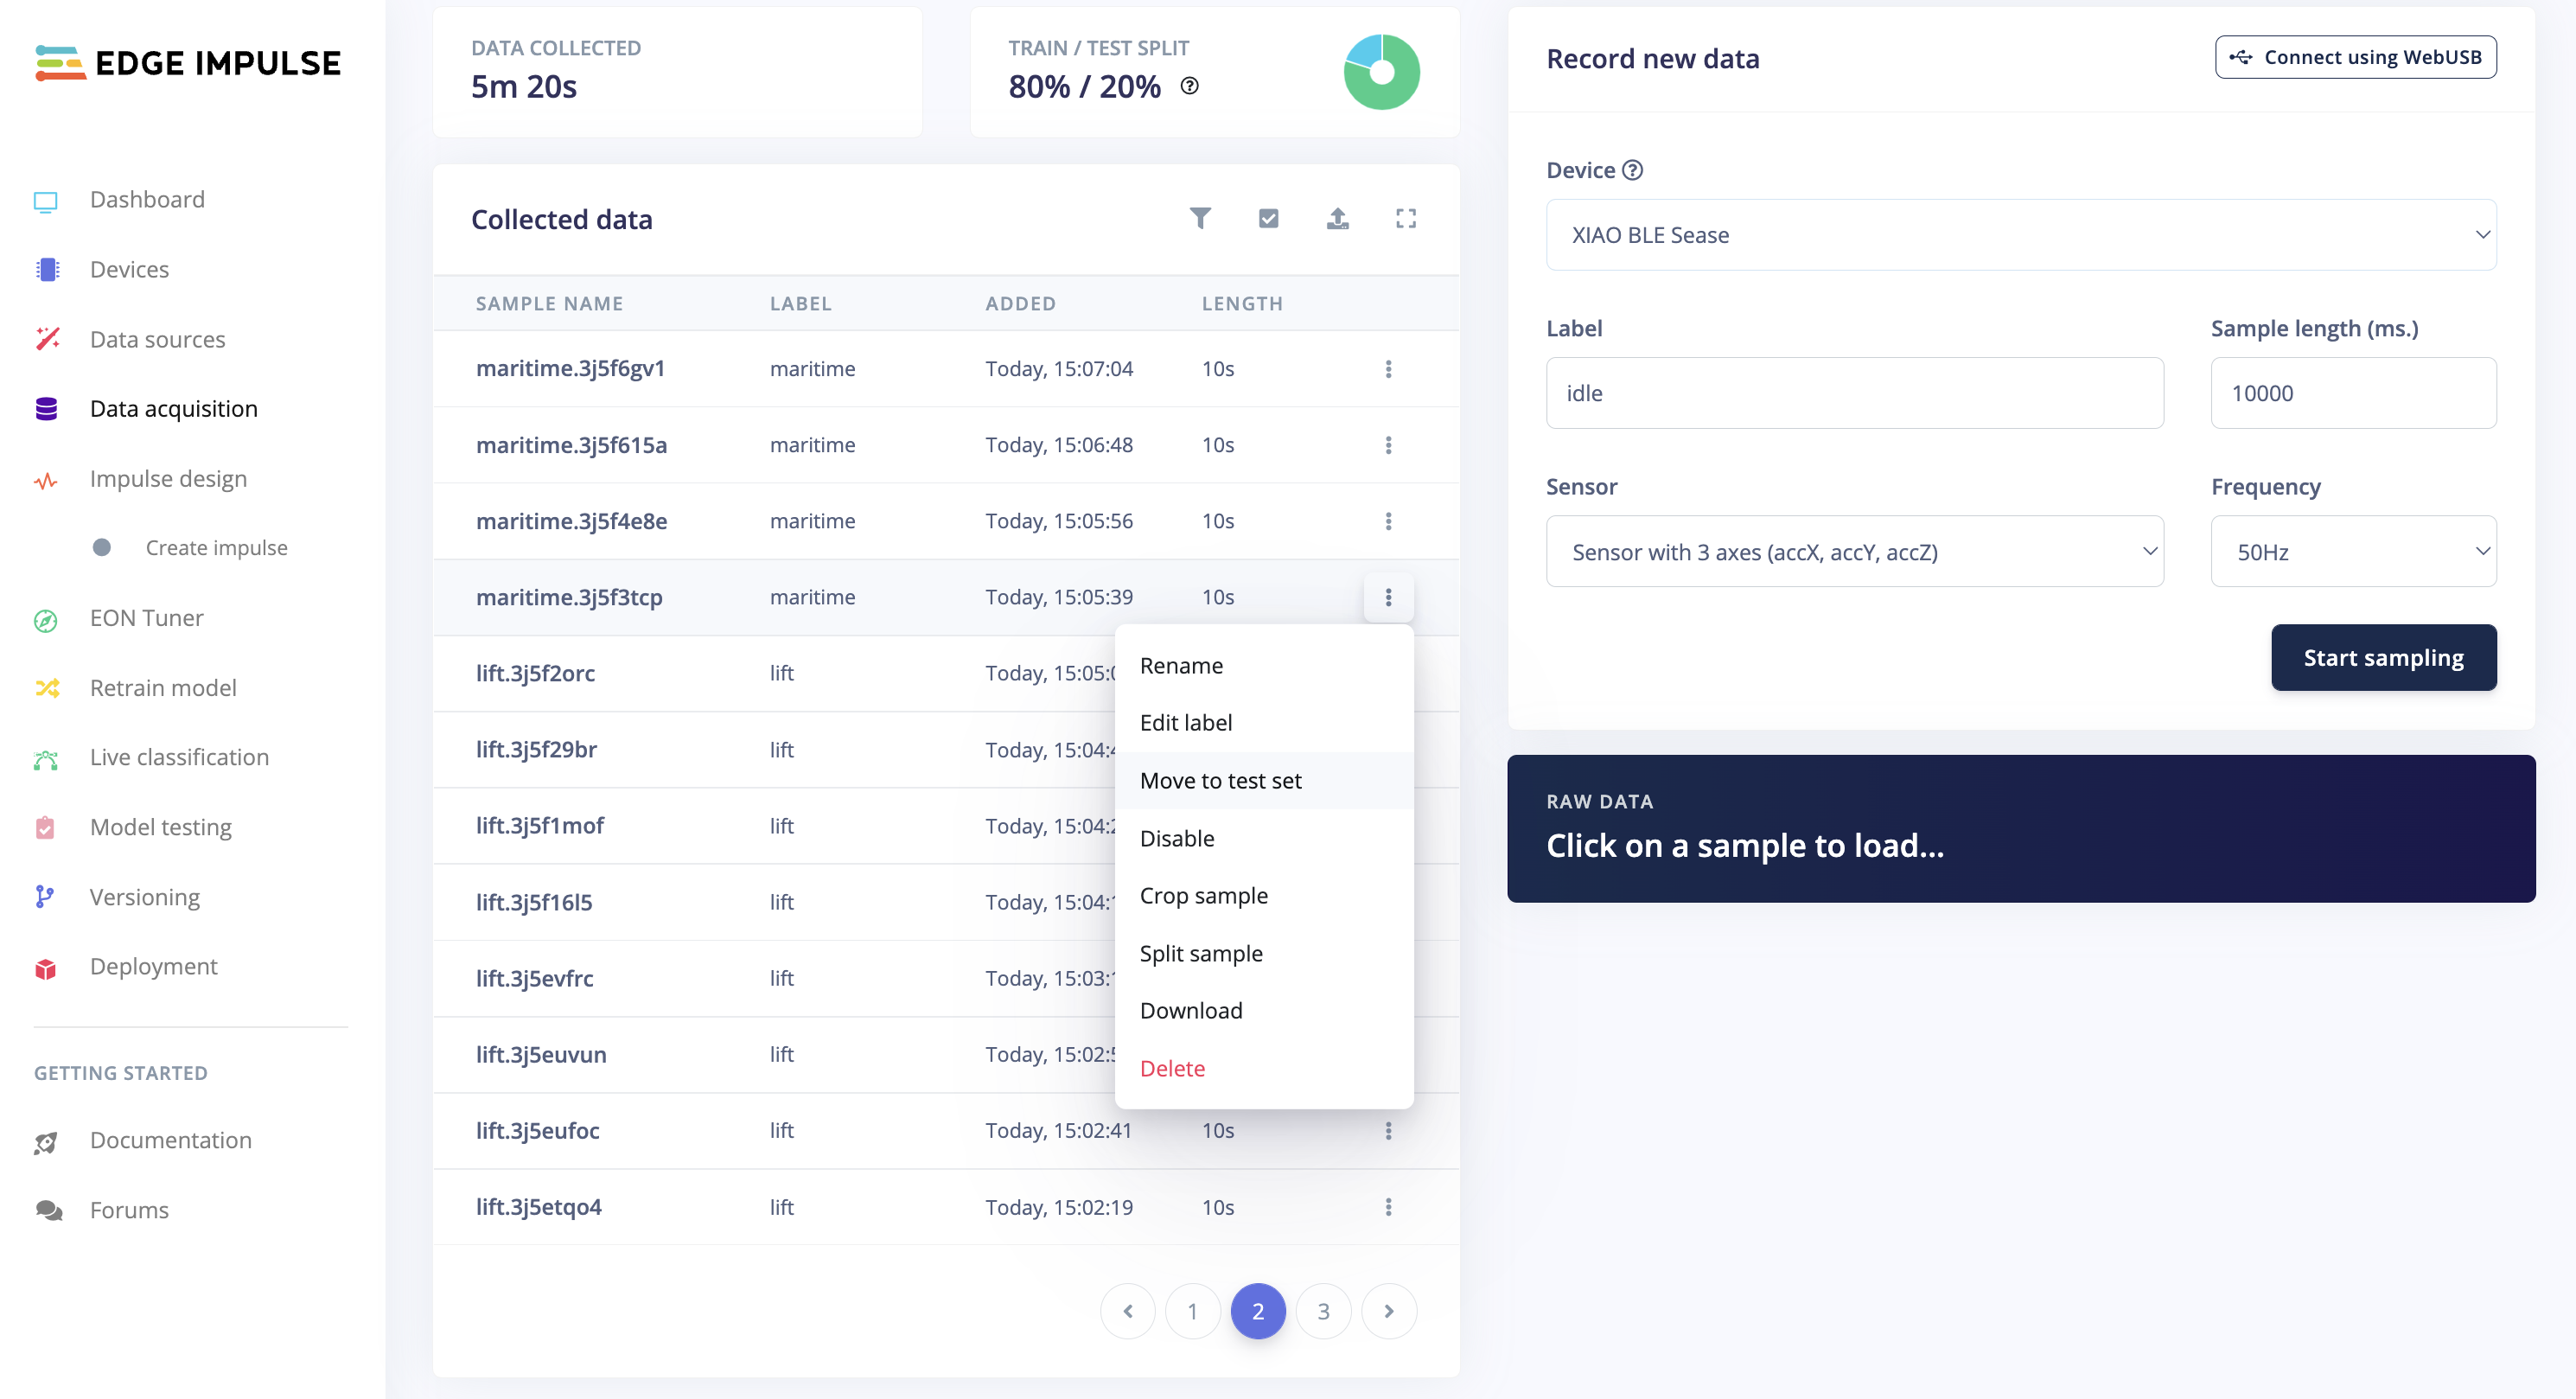 -->
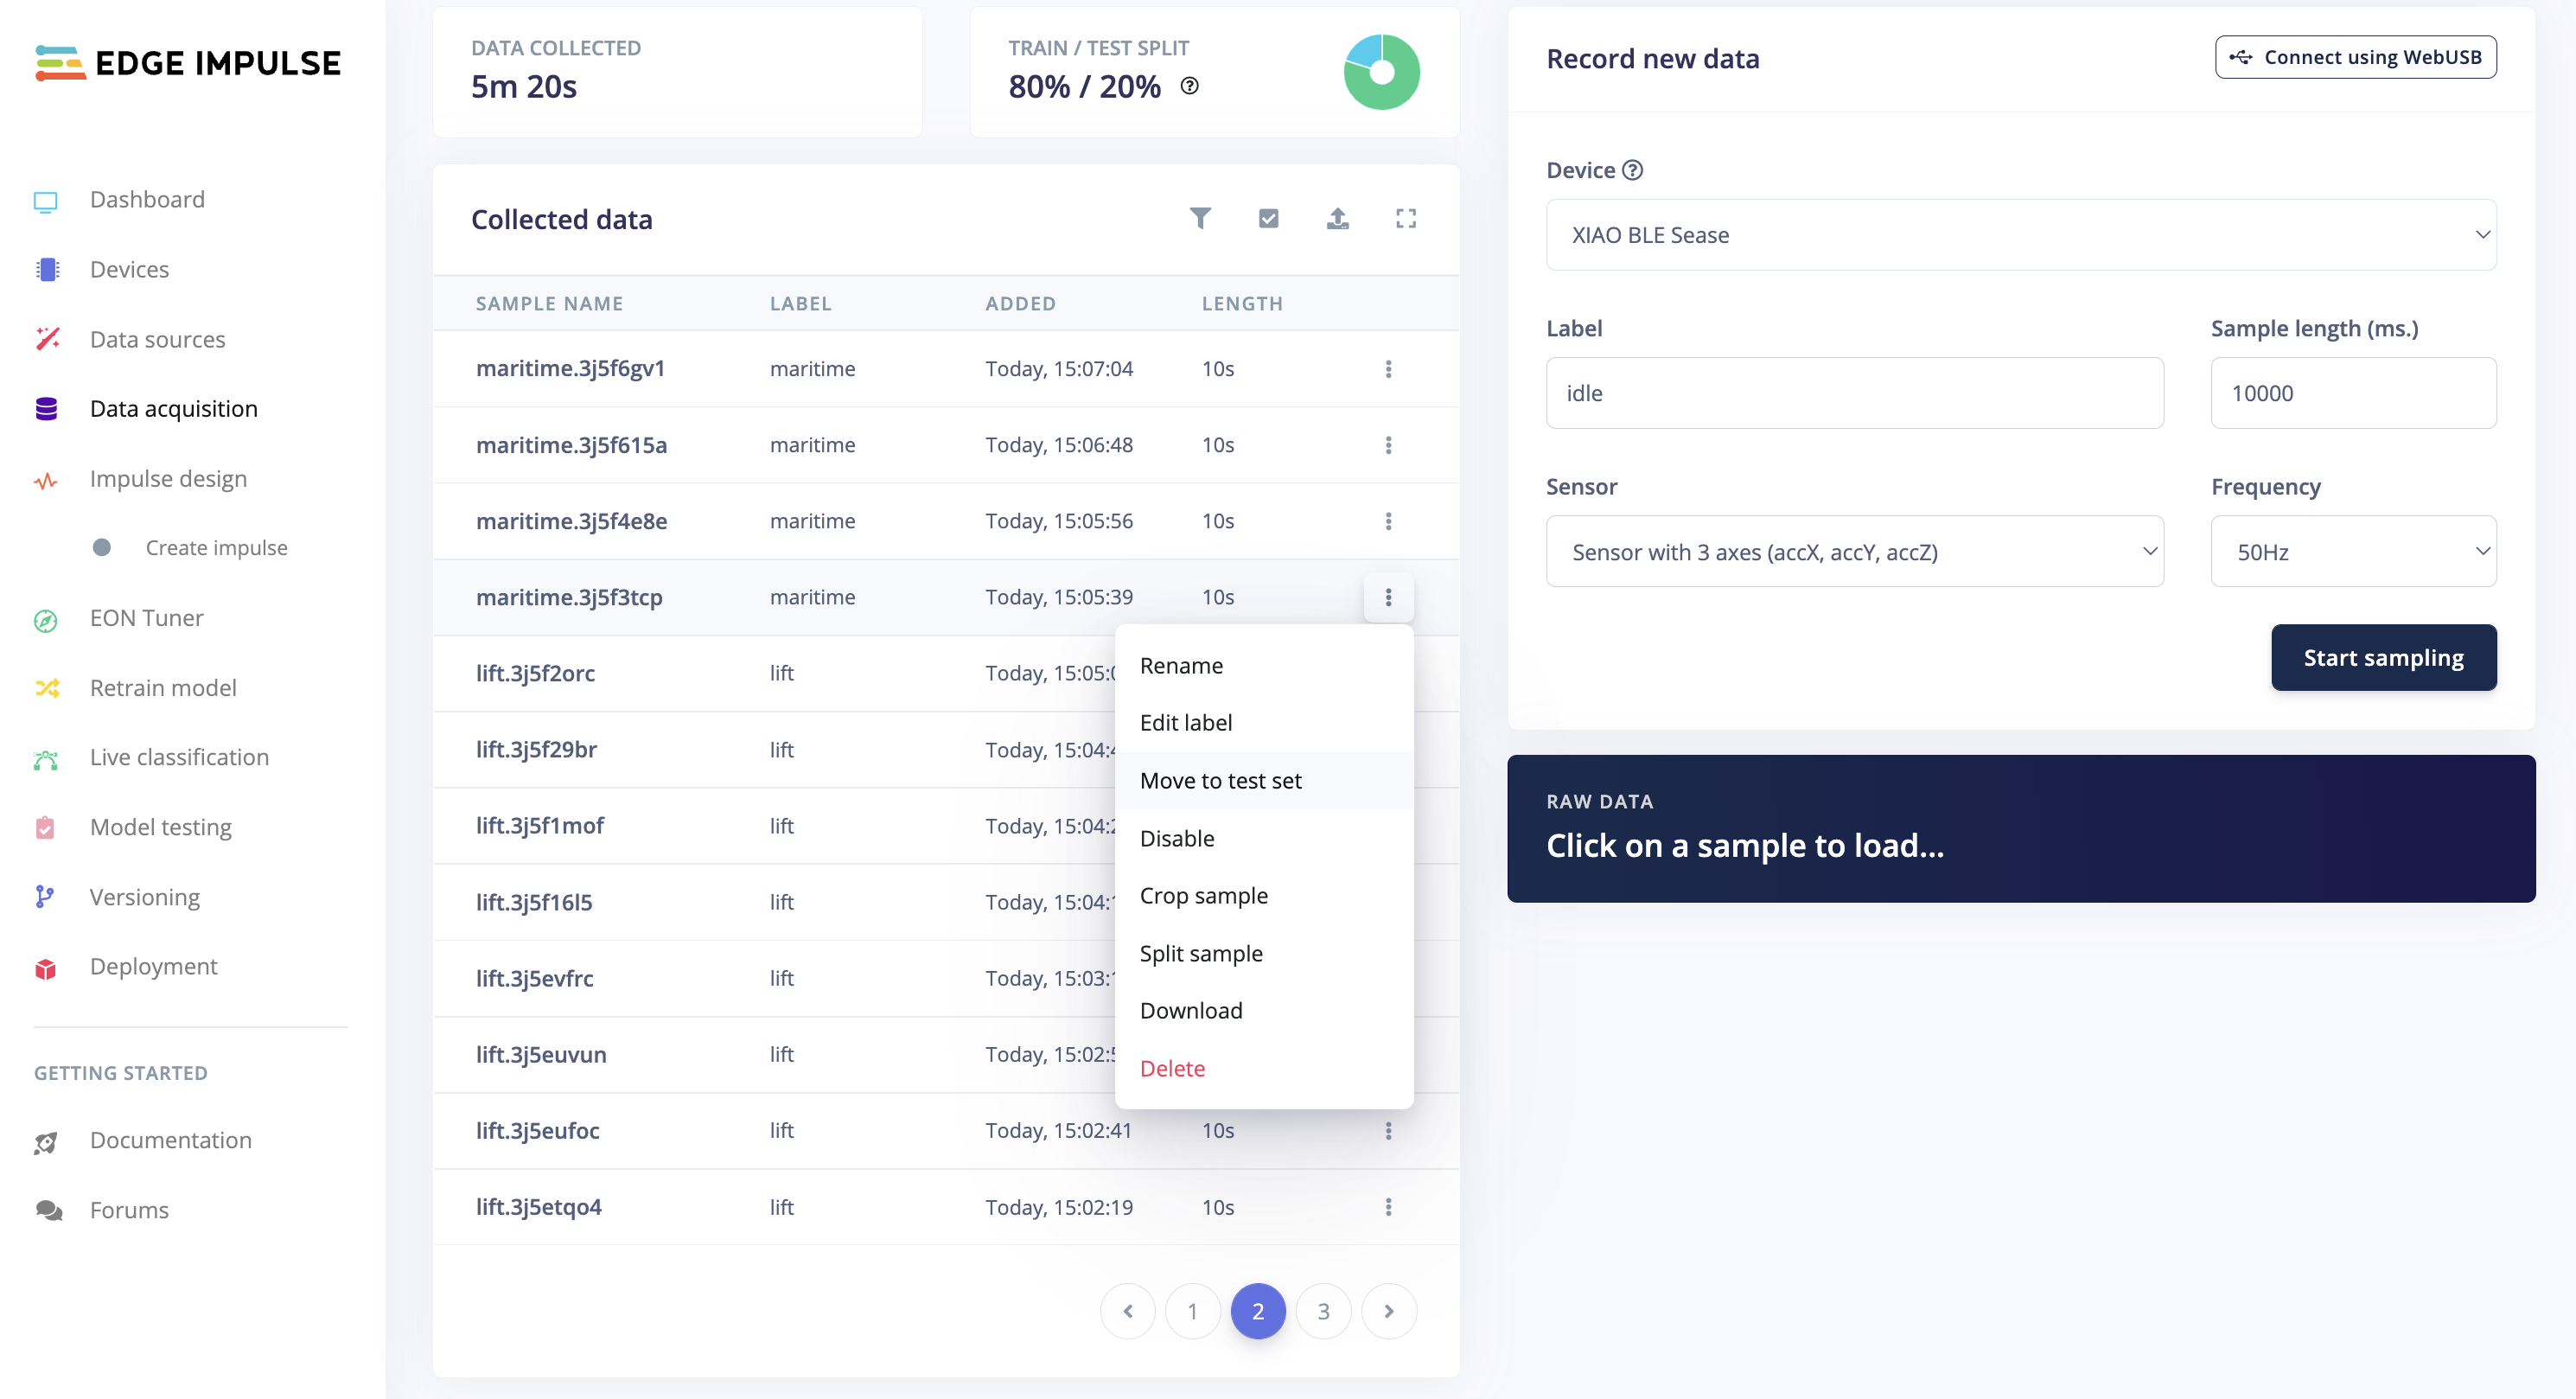
> Once you have captured your dataset, you can explore it in more detail using the [Data Explorer](https://docs.edgeimpulse.com/docs/edge-impulse-studio/data-acquisition/data-explorer), a visual tool to find outliers or mislabeled data (helping to correct them). The data explorer first tries to extract meaningful features from your data (by applying signal processing and neural network embeddings) and then uses a dimensionality reduction algorithm such as [PCA](https://en.wikipedia.org/wiki/Principal_component_analysis) or [t-SNE](https://en.wikipedia.org/wiki/T-distributed_stochastic_neighbor_embedding) to map these features to a 2D space. This gives you a one-look overview of your complete dataset.
### 4.2.4.3 Data Pre-Processing
Data pre-processing is extracting features from the dataset captured with the accelerometer, which involves processing and analyzing the raw data. Accelerometers measure the acceleration of an object along one or more axes (typically three, denoted as X, Y, and Z). These measurements can be used to understand various aspects of the object's motion, such as movement patterns and vibrations.
Raw accelerometer data can be noisy and contain errors or irrelevant information. Preprocessing steps, such as filtering and normalization, can clean and standardize the data, making it more suitable for feature extraction. In our case, we should divide the data into smaller segments or **windows**. This can help focus on specific events or activities within the dataset, making feature extraction more manageable and meaningful. The **window size** and overlap (**window increase**) choice depend on the application and the frequency of the events of interest. As a thumb rule, we should try to capture a couple of "cycles of data".
> With a sampling rate (SR) of 50Hz and a window size of 2 seconds, we will get 100 samples per axis, or 300 in total (3 axis x 2 seconds x 50 samples). We will slide this window every 200ms, creating a larger dataset where each instance has 300 raw features.

Once the data is preprocessed and segmented, you can extract features that describe the motion's characteristics. Some typical features extracted from accelerometer data include: - **Time-domain** features describe the data's statistical properties within each segment, such as mean, median, standard deviation, skewness, kurtosis, and zero-crossing rate. - **Frequency-domain** features are obtained by transforming the data into the frequency domain using techniques like the Fast Fourier Transform (FFT). Some typical frequency-domain features include the power spectrum, spectral energy, dominant frequencies (amplitude and frequency), and spectral entropy. - **Time-frequency** domain features combine the time and frequency domain information, such as the Short-Time Fourier Transform (STFT) or the Discrete Wavelet Transform (DWT). They can provide a more detailed understanding of how the signal's frequency content changes over time.
In many cases, the number of extracted features can be large, which may lead to overfitting or increased computational complexity. Feature selection techniques, such as mutual information, correlation-based methods, or principal component analysis (PCA), can help identify the most relevant features for a given application and reduce the dimensionality of the dataset. The Studio can help with such feature importance calculations.
**EI Studio Spectral Features**
Data preprocessing is a challenging area for embedded machine learning. Still, Edge Impulse helps overcome this with its digital signal processing (DSP) preprocessing step and, more specifically, the [Spectral Features Block](https://docs.edgeimpulse.com/docs/edge-impulse-studio/processing-blocks/spectral-features).
On the Studio, the collected raw dataset will be the input of a Spectral Analysis block, which is excellent for analyzing repetitive motion, such as data from accelerometers. This block will perform a DSP (Digital Signal Processing), extracting features such as [FFT](https://en.wikipedia.org/wiki/Fast_Fourier_transform) or [Wavelets](https://en.wikipedia.org/wiki/Digital_signal_processing#Wavelet).
For our project, once the time signal is continuous, we should use FFT with, for example, a length of `[32]`.
The per axis/channel **Time Domain Statistical features** are:
- [RMS](https://en.wikipedia.org/wiki/Root_mean_square): 1 feature
- [Skewness](https://colab.research.google.com/corgiredirector?site=https%3A%2F%2Fen.wikipedia.org%2Fwiki%2FSkewness): 1 feature
- [Kurtosis](https://colab.research.google.com/corgiredirector?site=https%3A%2F%2Fen.wikipedia.org%2Fwiki%2FKurtosis): 1 feature
The per axis/channel **Frequency Domain Spectral features** are:
- [Spectral Power](https://en.wikipedia.org/wiki/Spectral_density): 16 features (FFT Length/2)
- Skewness: 1 feature
- Kurtosis: 1 feature
So, for an FFT length of 32 points, the resulting output of the Spectral Analysis Block will be 21 features per axis (a total of 63 features).
> You can learn more about how each feature is calculated by downloading the notebook [Edge Impulse - Spectral Features Block Analysis](https://github.com/Mjrovai/Arduino_Nicla_Vision/blob/main/Motion_Classification/Edge_Impulse_Spectral_Features_Block.ipynb) [TinyML under the hood: Spectral Analysis](https://www.hackster.io/mjrobot/tinyml-under-the-hood-spectral-analysis-94676c) or [opening it directly on Google CoLab](https://colab.research.google.com/github/Mjrovai/Arduino_Nicla_Vision/blob/main/Motion_Classification/Edge_Impulse_Spectral_Features_Block.ipynb).
Those 63 features will be the Input Tensor of a Neural Network Classifier.
### 4.2.4.4 Model Design
Our classifier will be a Dense Neural Network (DNN) that will have 63 neurons on its input layer, two hidden layers with 20 and 10 neurons, and an output layer with four neurons (one per each class), as shown here:

### 4.2.4.5 Impulse Design
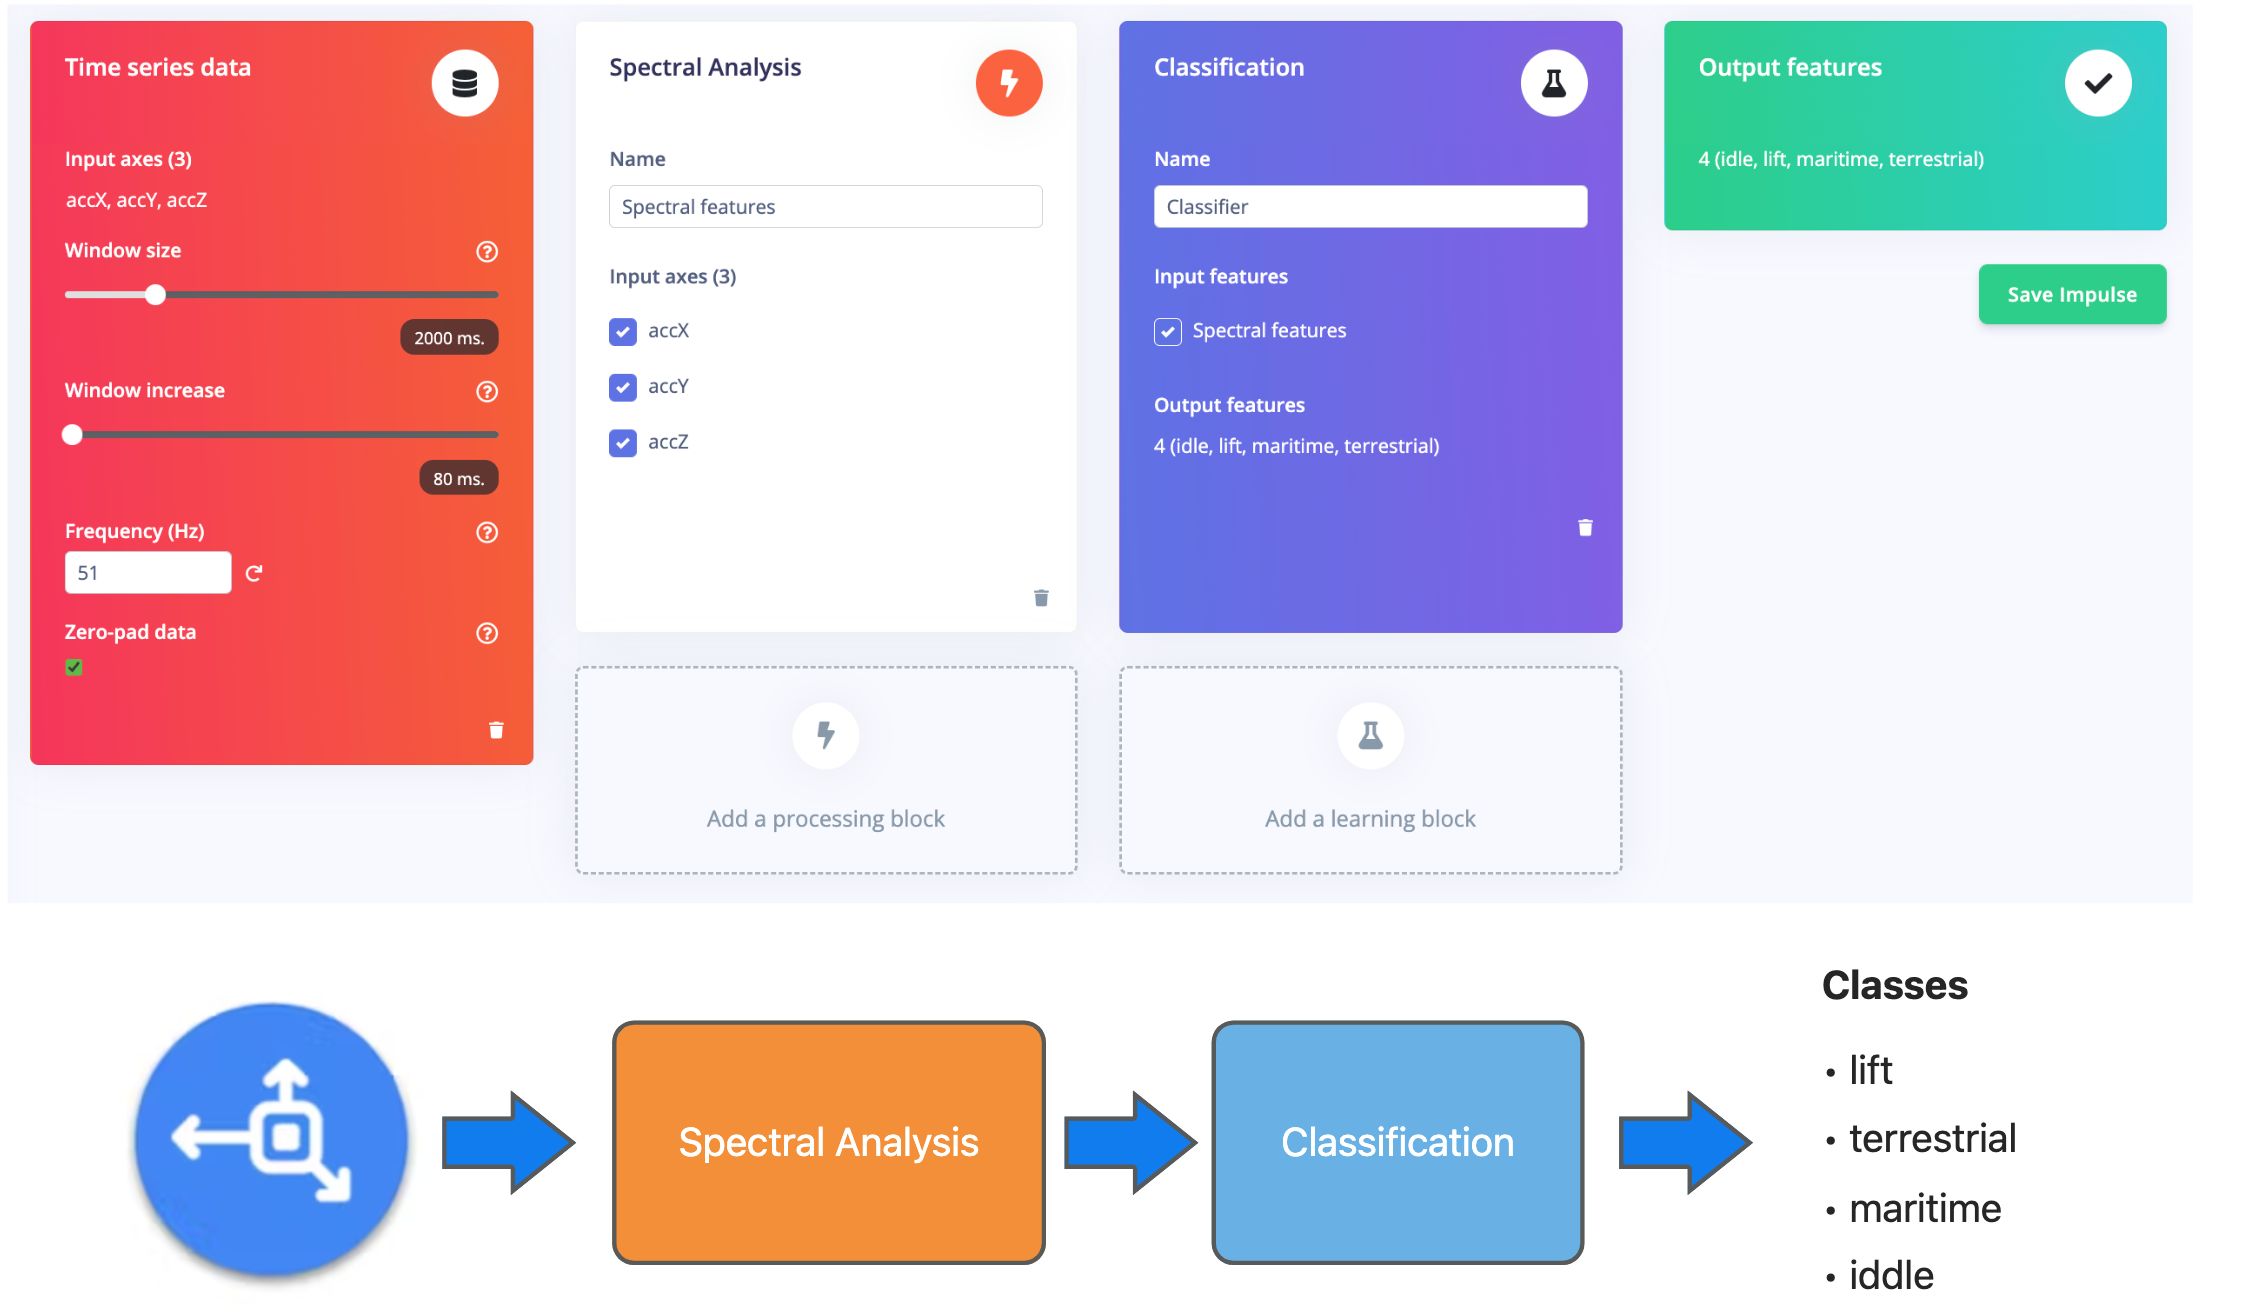
A complete Impulse comprises three primary building blocks: the input block - which obtains the raw data, the processing block - which extracts features, and the learning block - which classifies the data. The following image shows the interface when the three building blocks still need to be added, and our machine-learning pipeline will be implemented by adding these three blocks.
<!--  -->

Impulse obtains raw data through the input block, uses the processing block to extract features, and then uses the learning block to classify new data. In our continuous action recognition, the added blocks include:
#### **1. Adding the input block: Time Series Data**
Click the "**Add an Input Block**" button and select **Time Series Data** in the pop-up window as shown below to match the sensor data type we collected.
<!-- 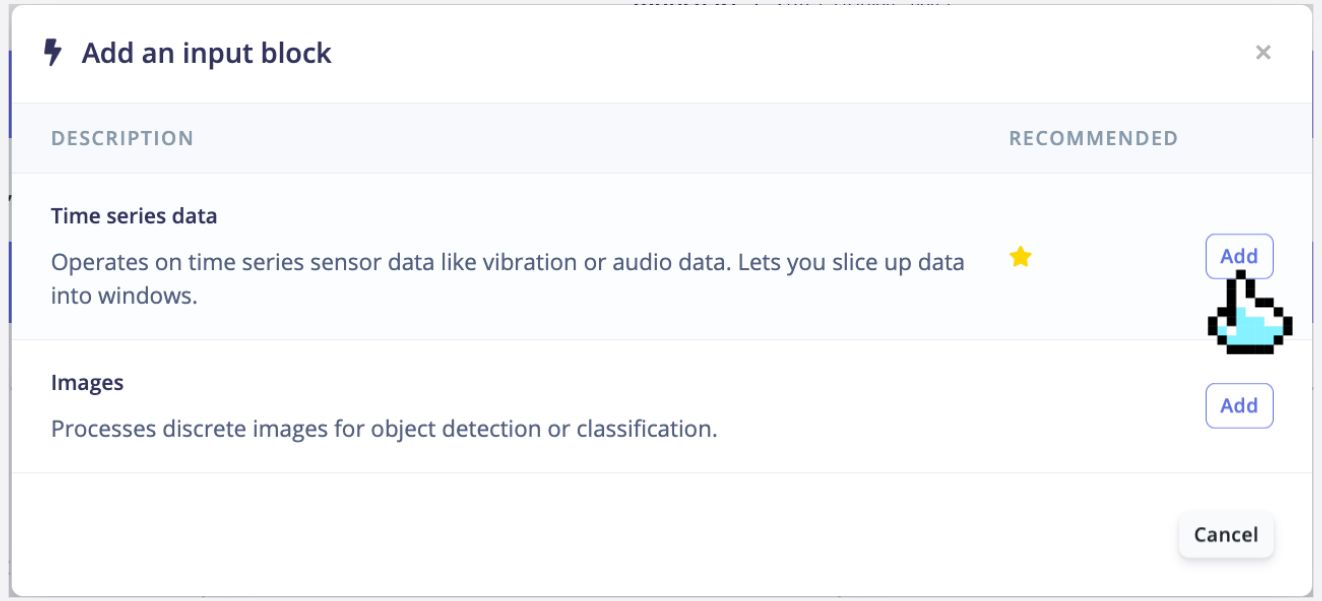 -->
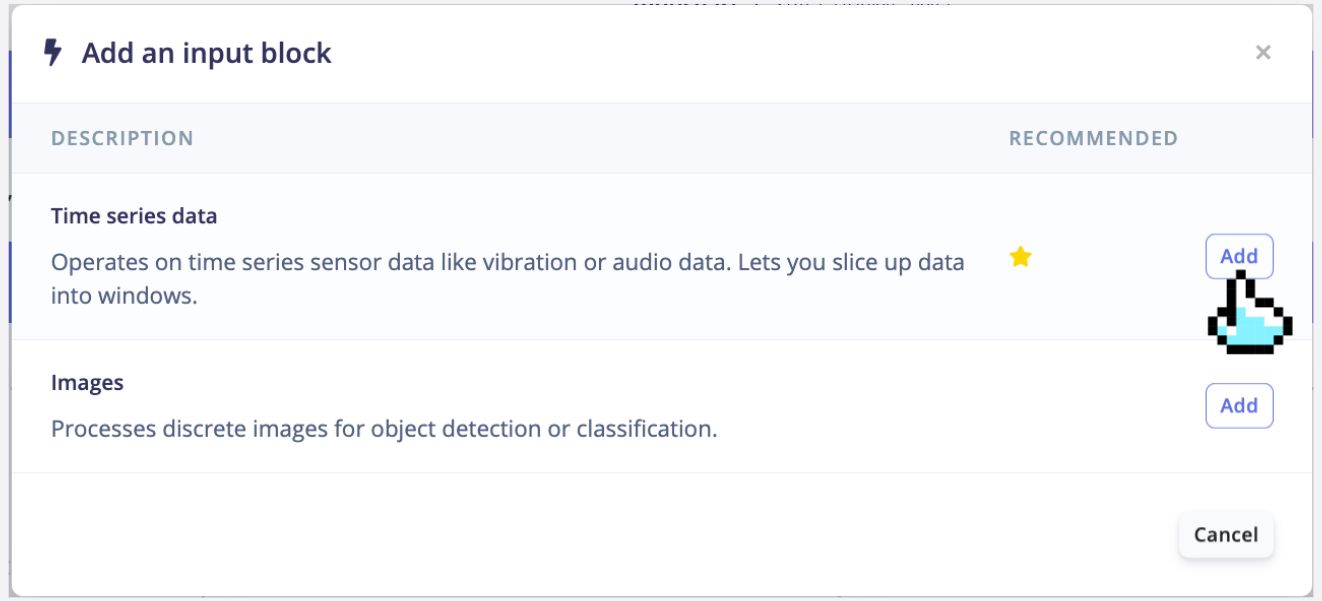
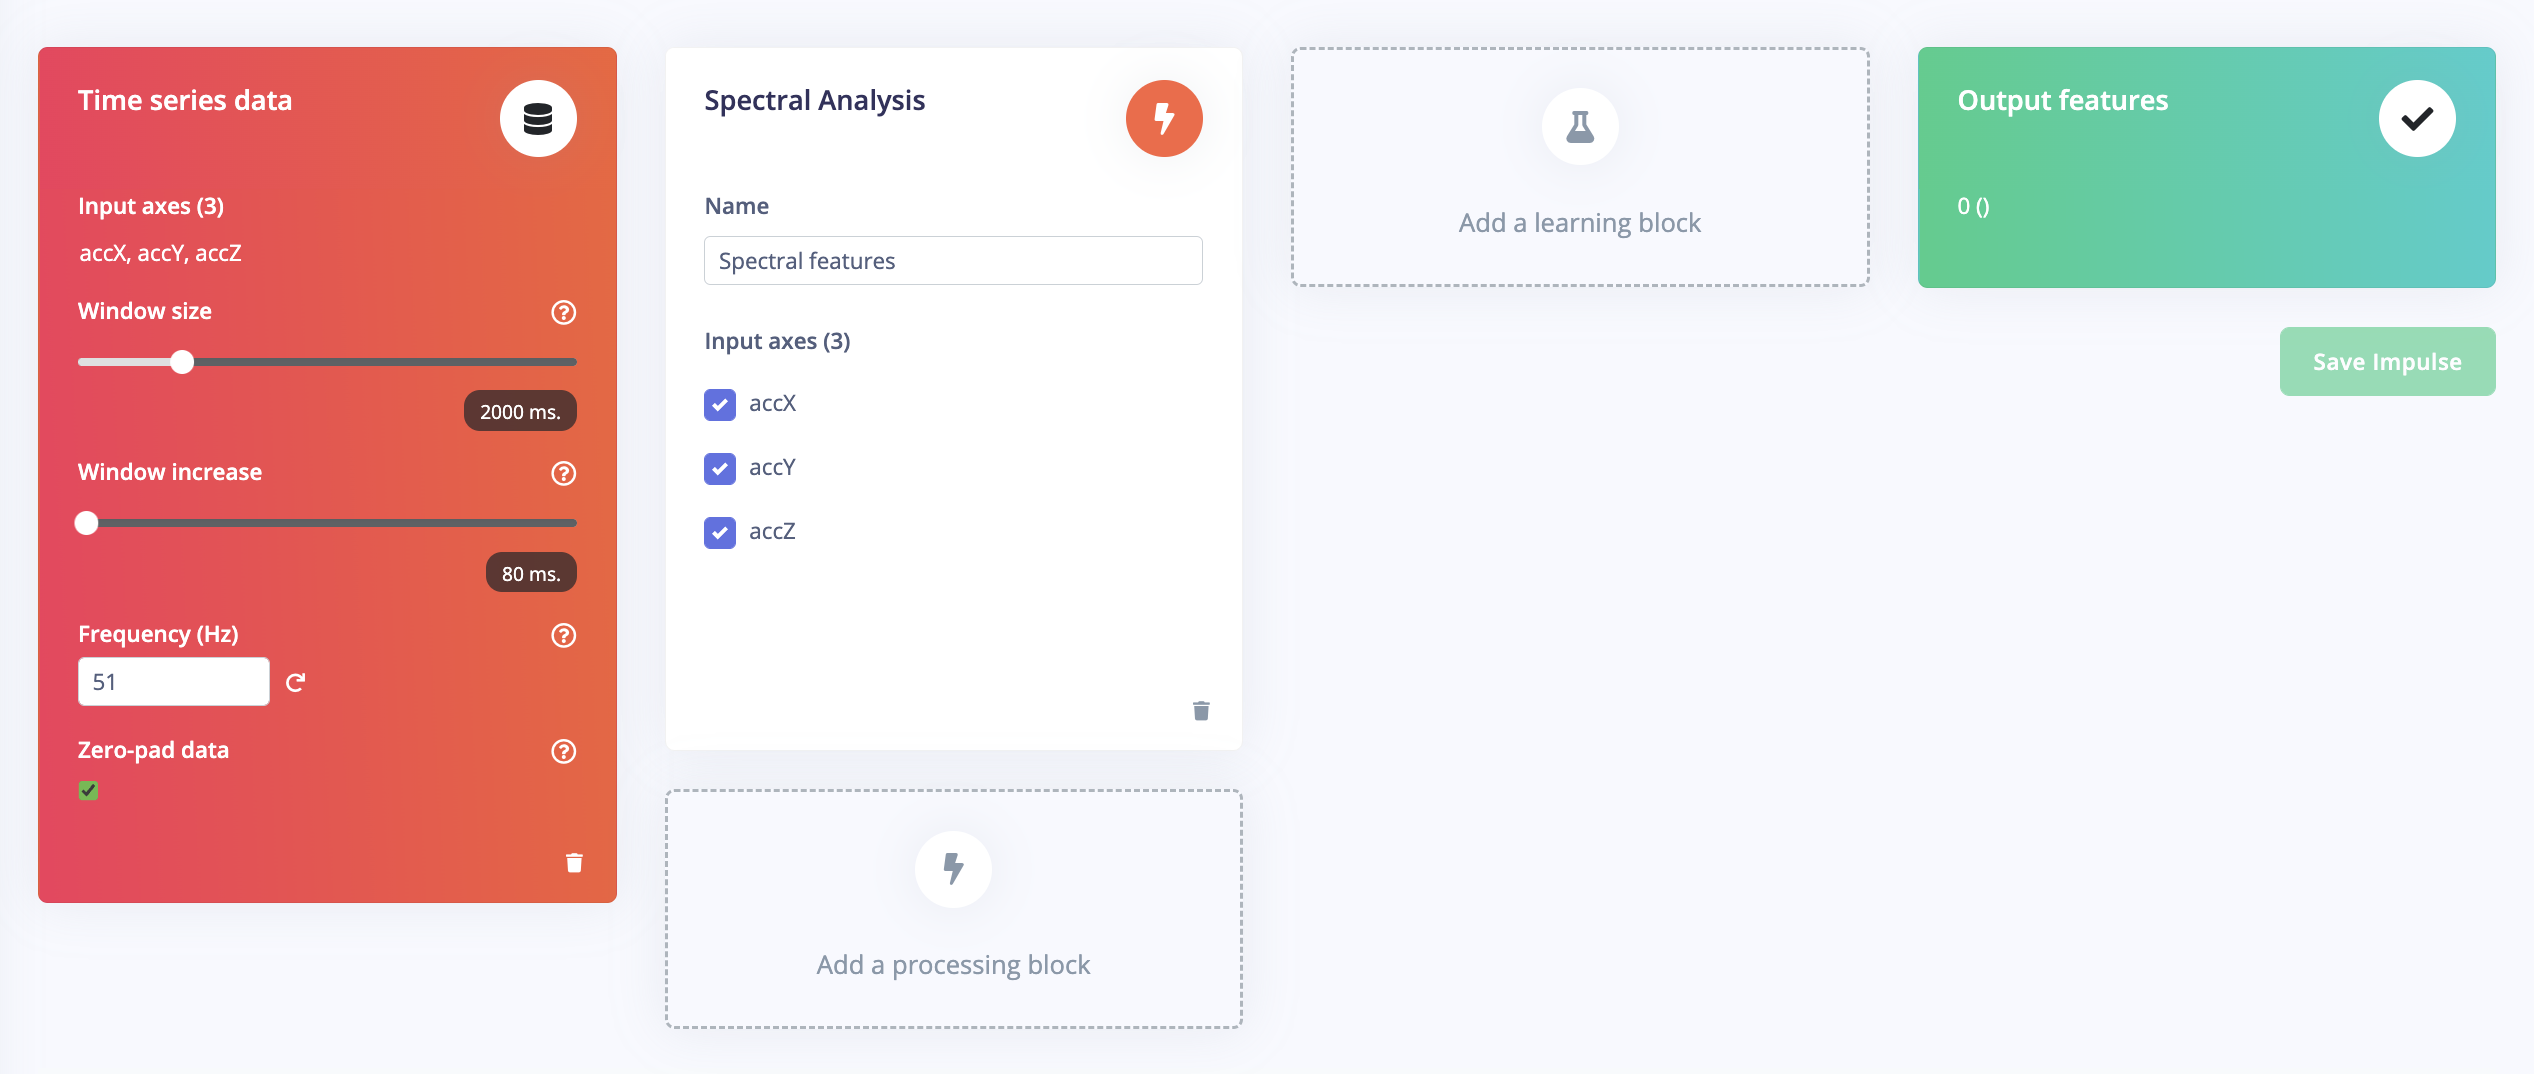
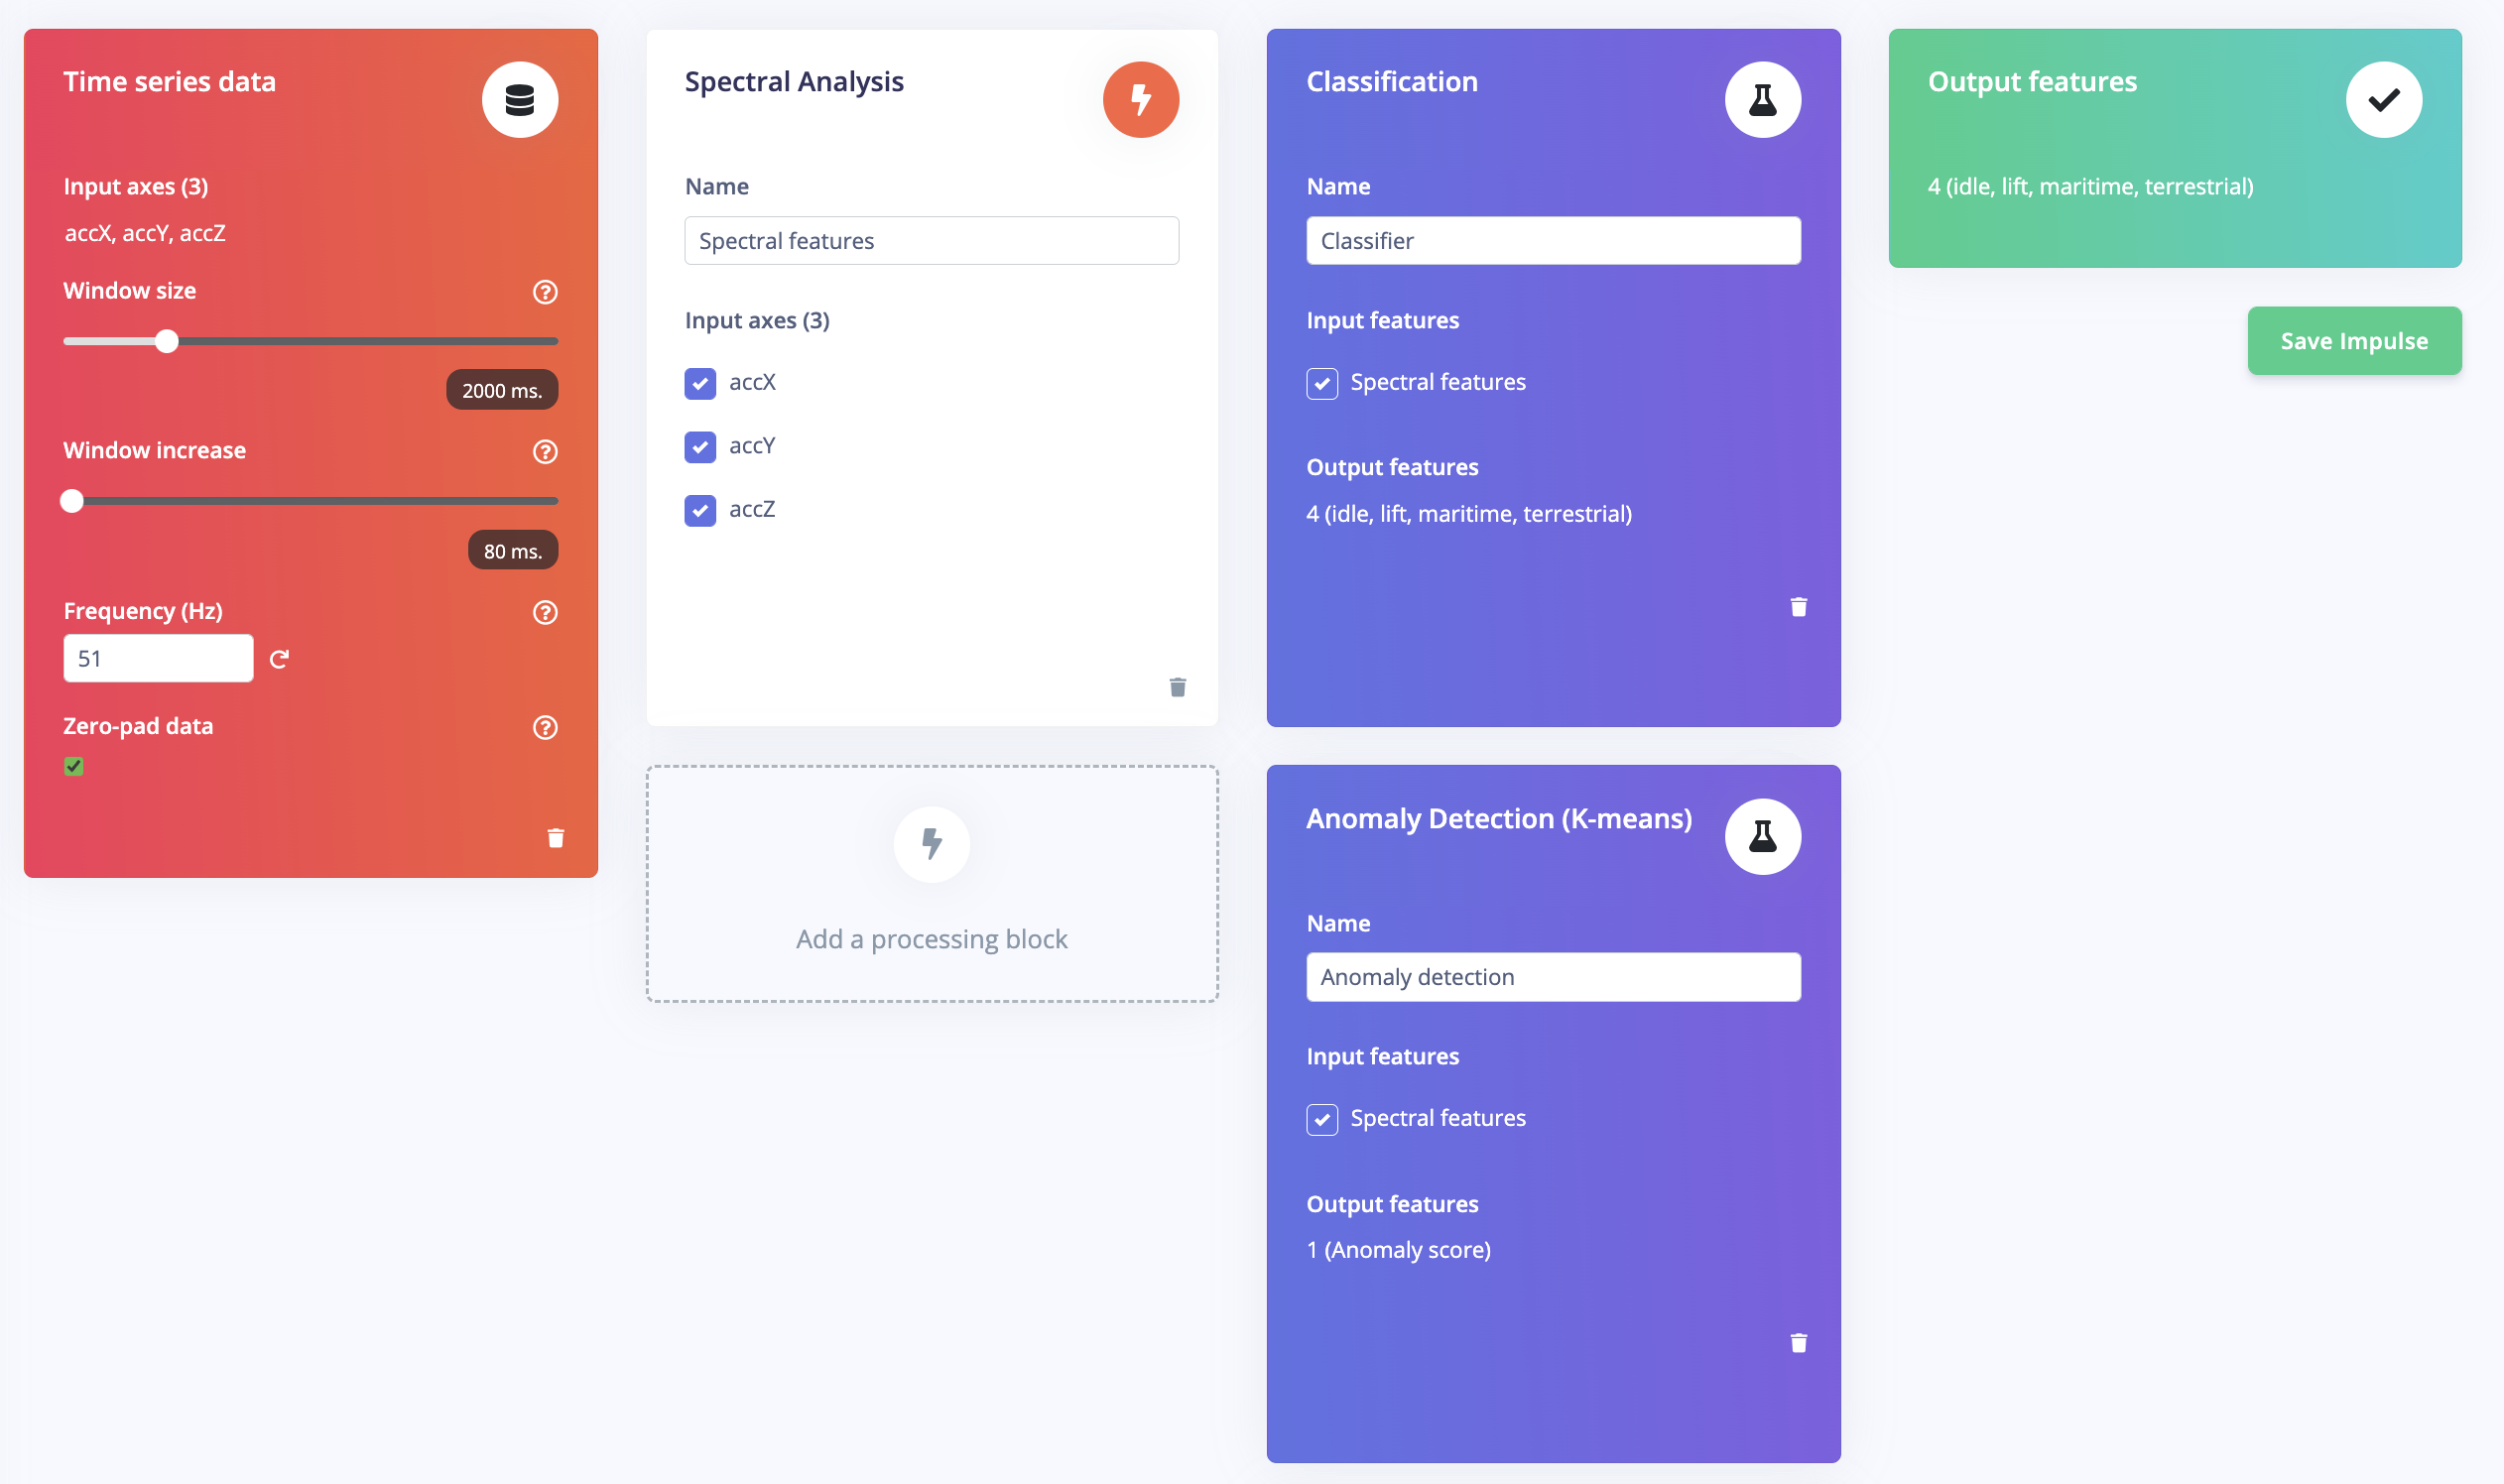
As shown in the figure below, set the **Window Size** to `2000` ms (2 seconds), the **Window Increase** to `80` milliseconds, and the **Frequency** to `51` Hz based on the calculations we made in the data preprocessing section on the Time Series Data block that appears.
<!-- 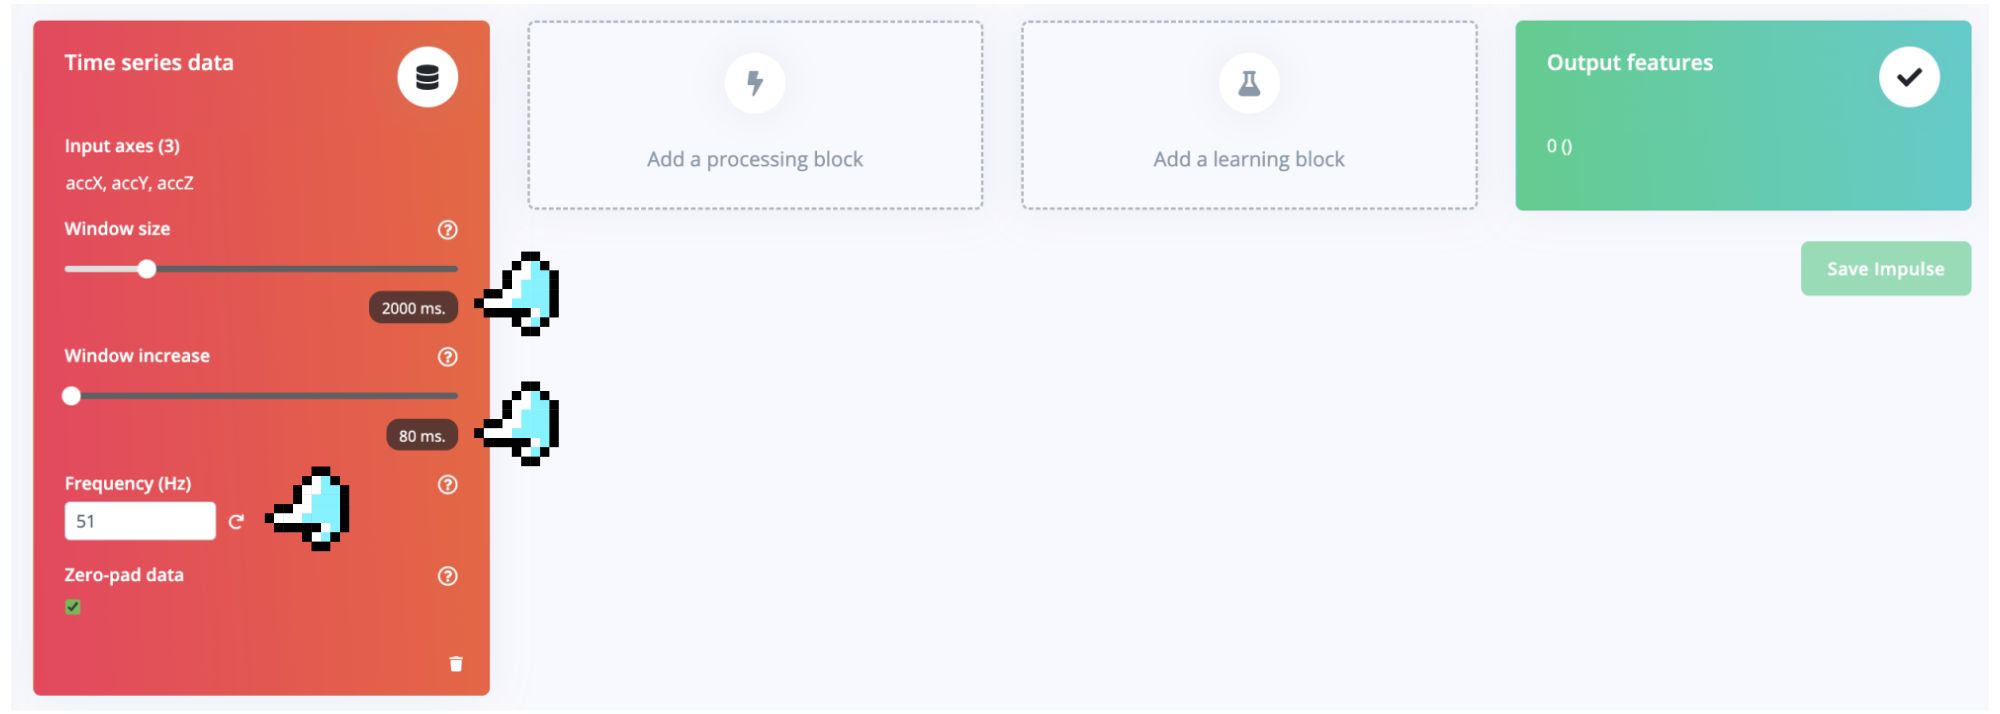 -->
#### **2. Adding the processing block: Spectral Analysis**
Click the "**Add a Processing Block**" button and select **Spectral Analysis** in the pop-up window as shown below to match our motion analysis task type.
<!-- 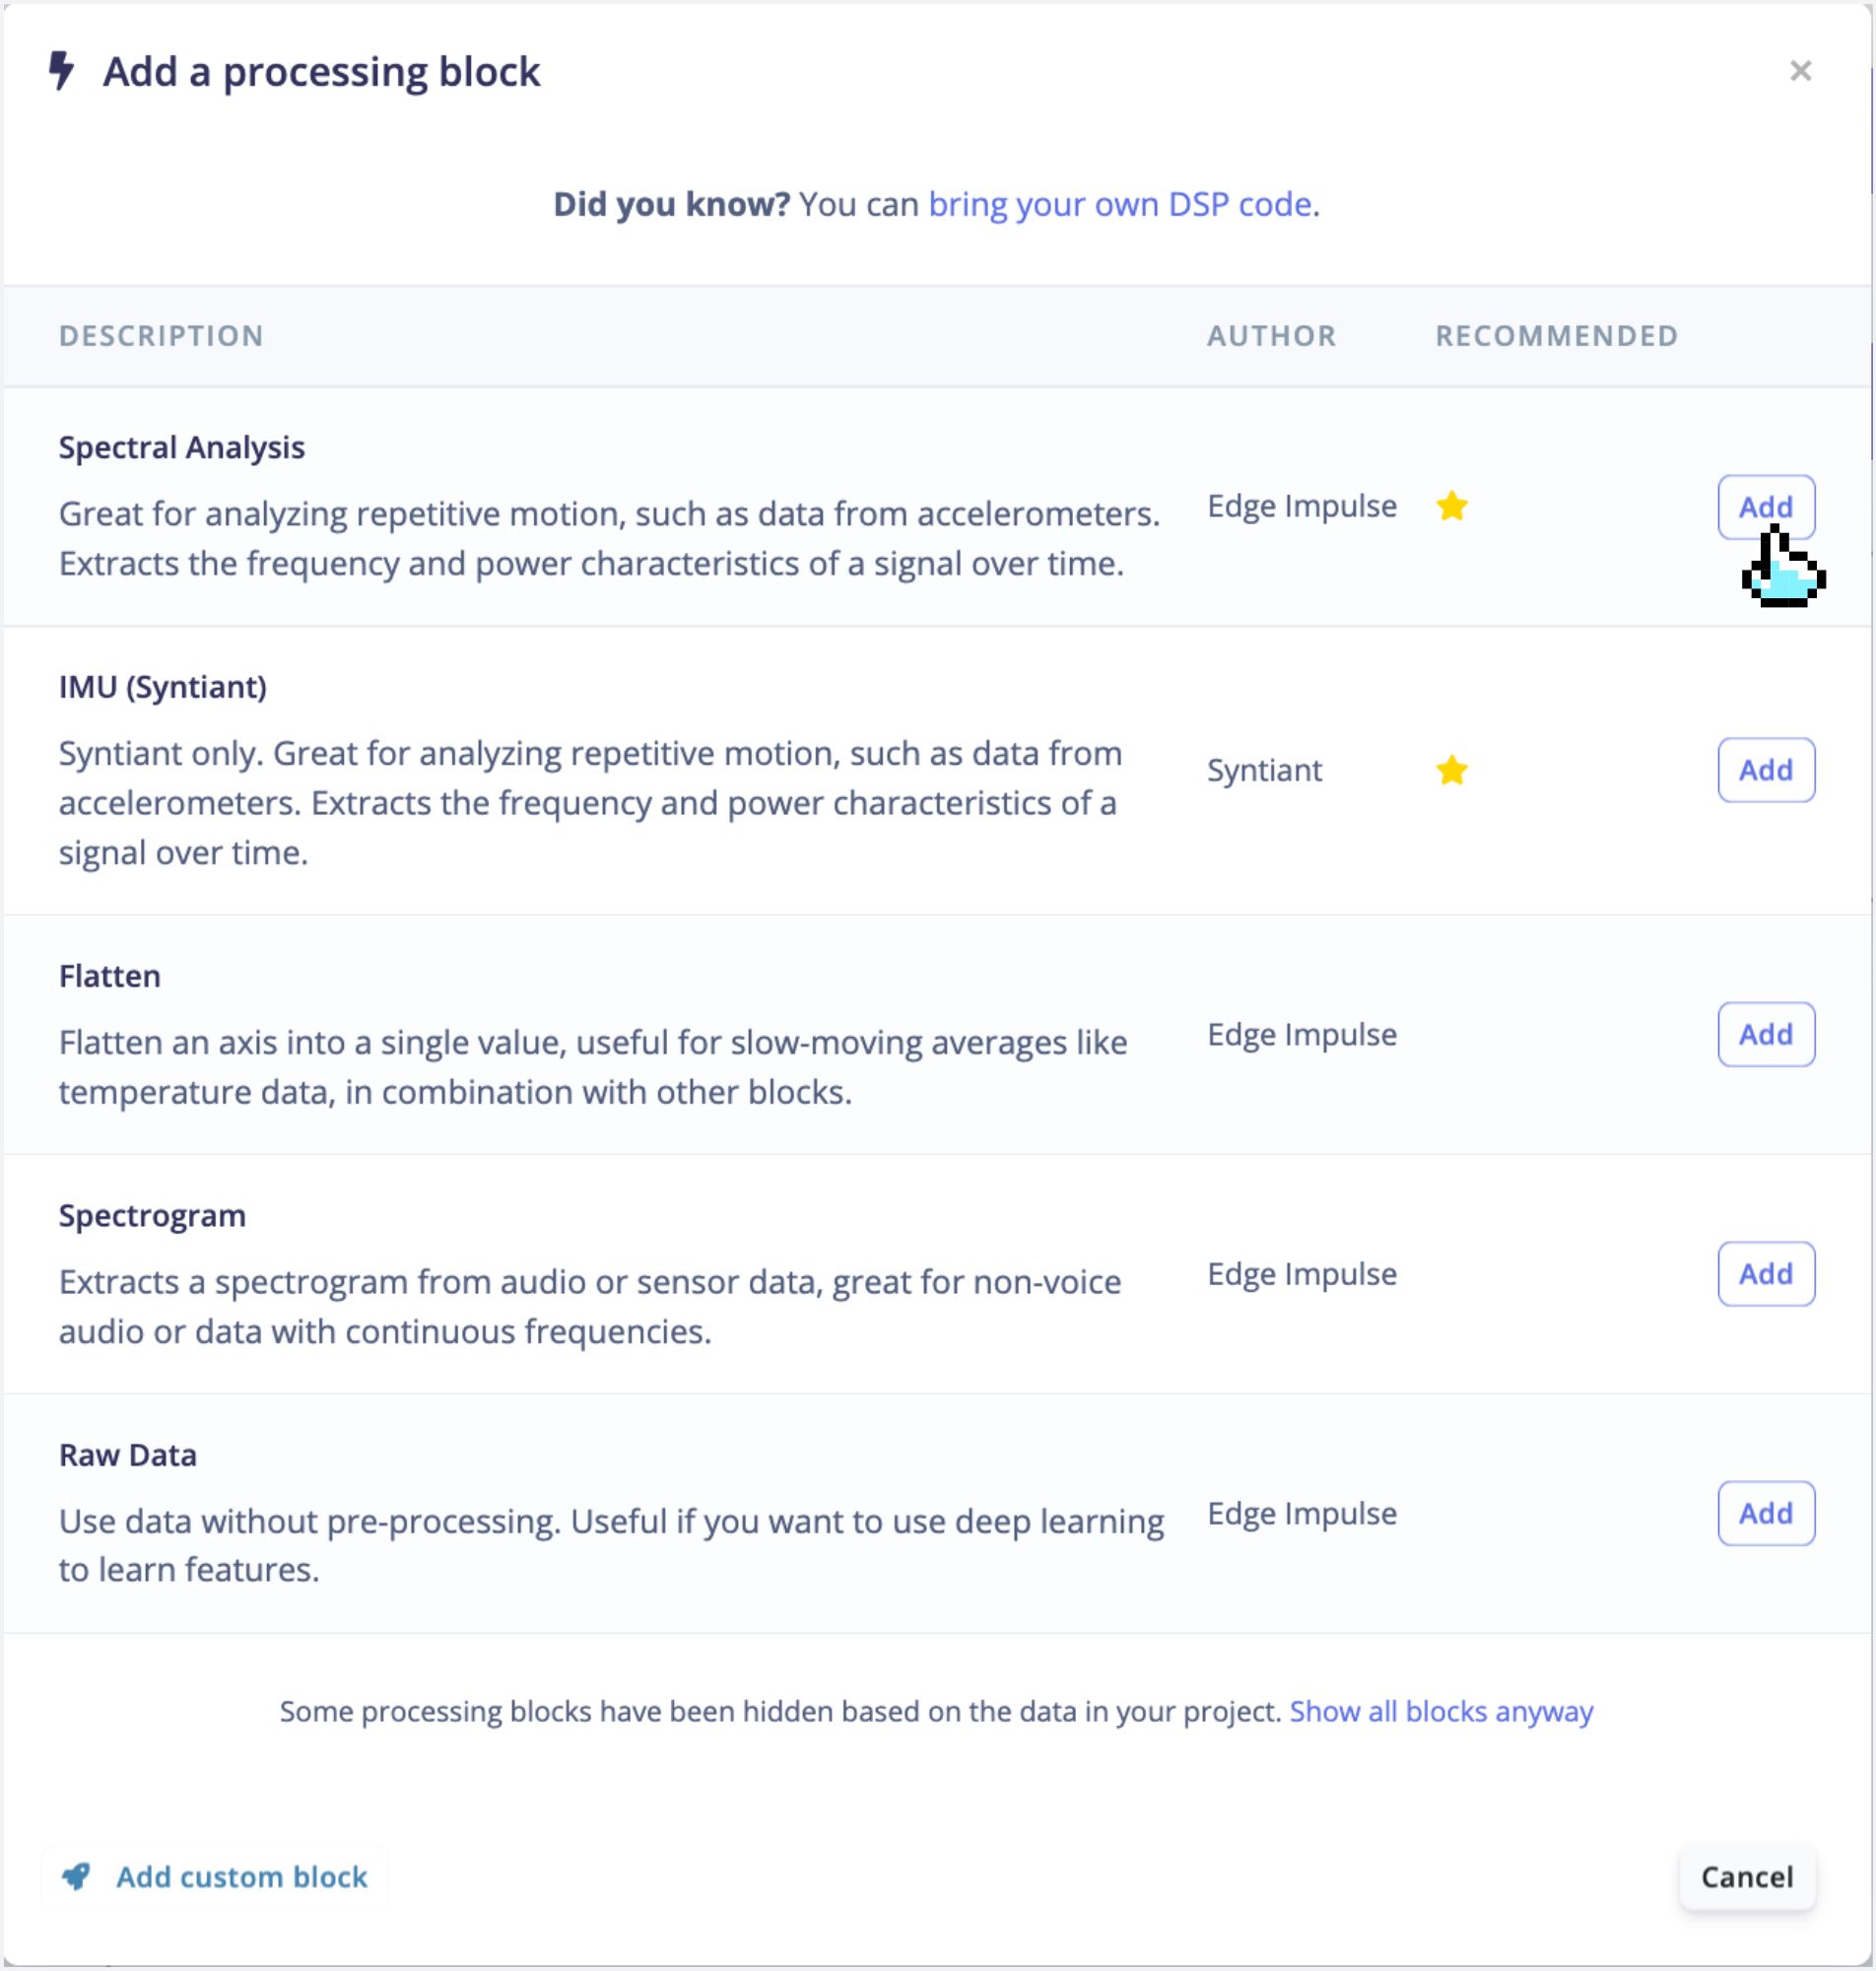 -->
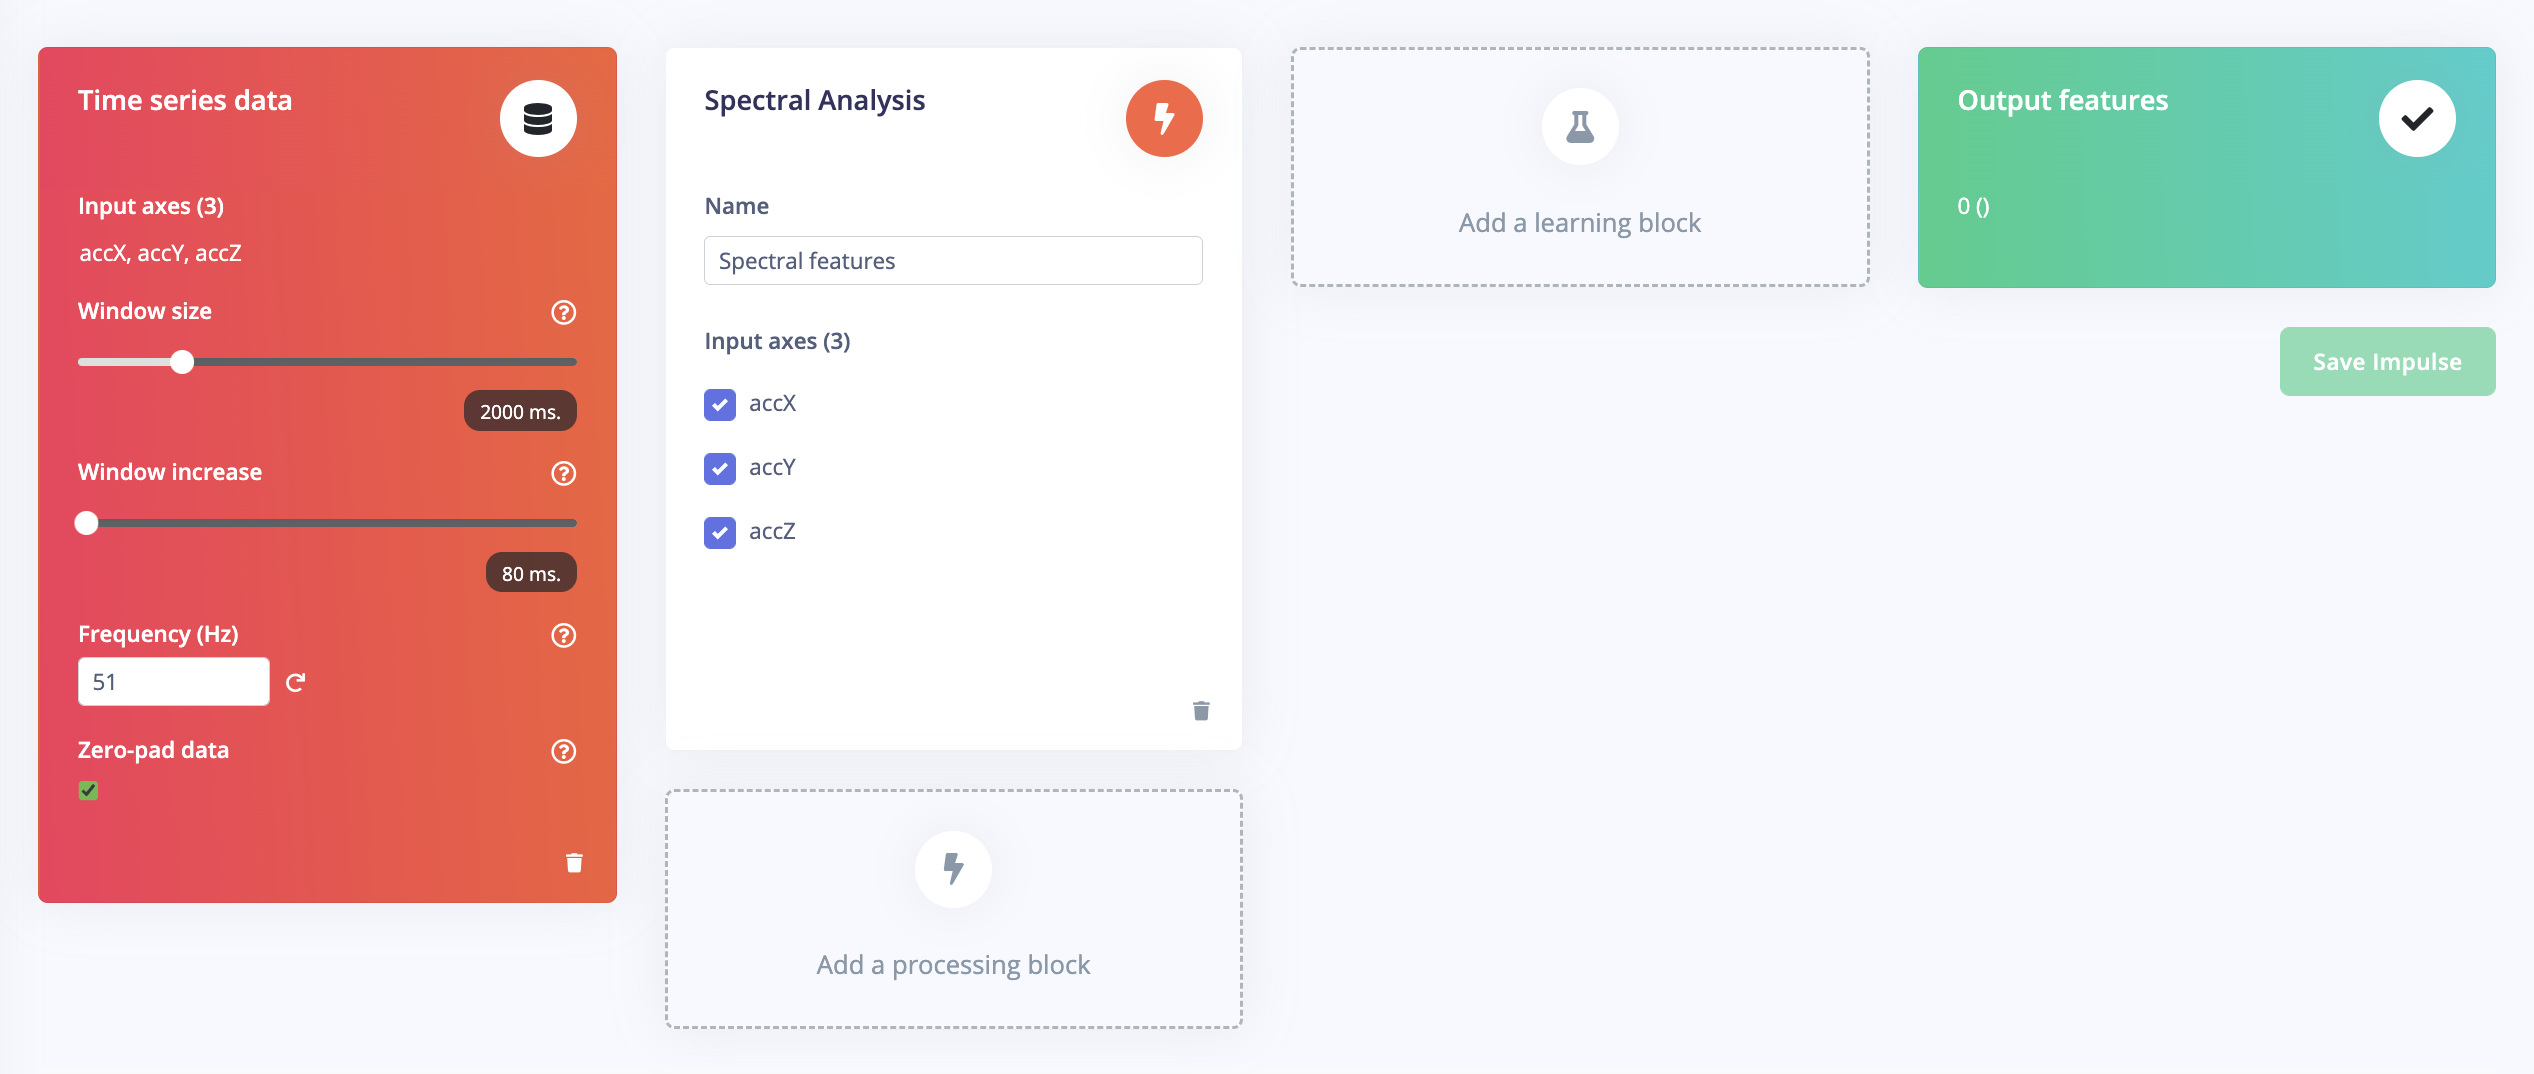
The effect after adding the processing block is shown in the figure below.
<!--  -->
#### **3. Adding the learning block: Classification**
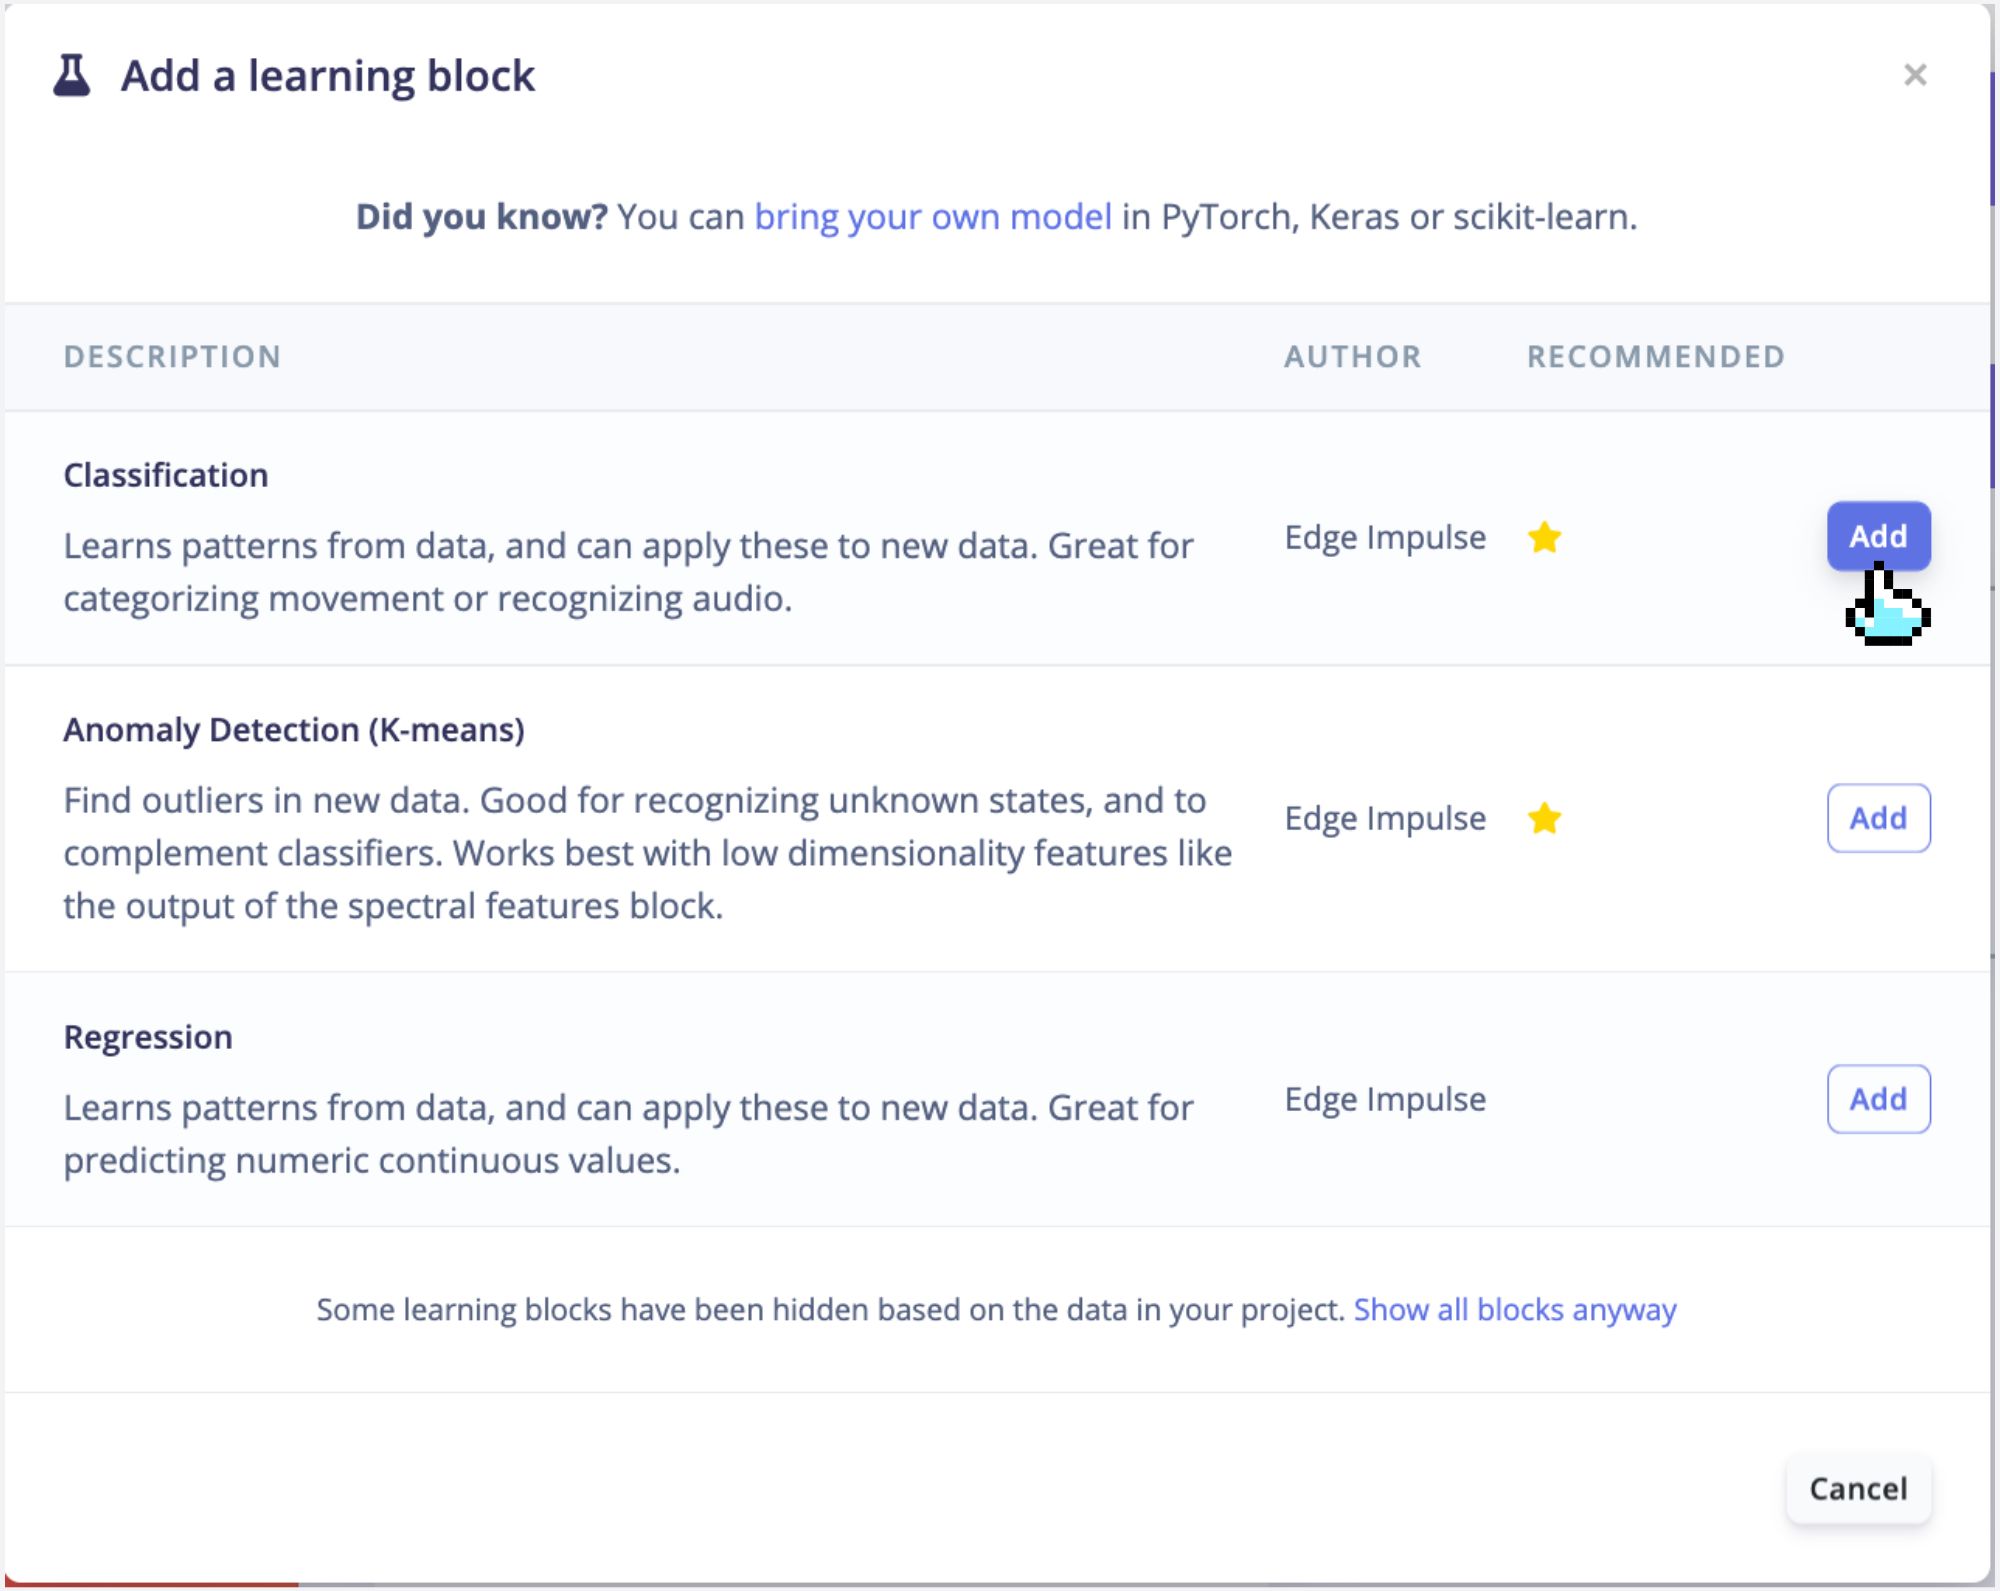
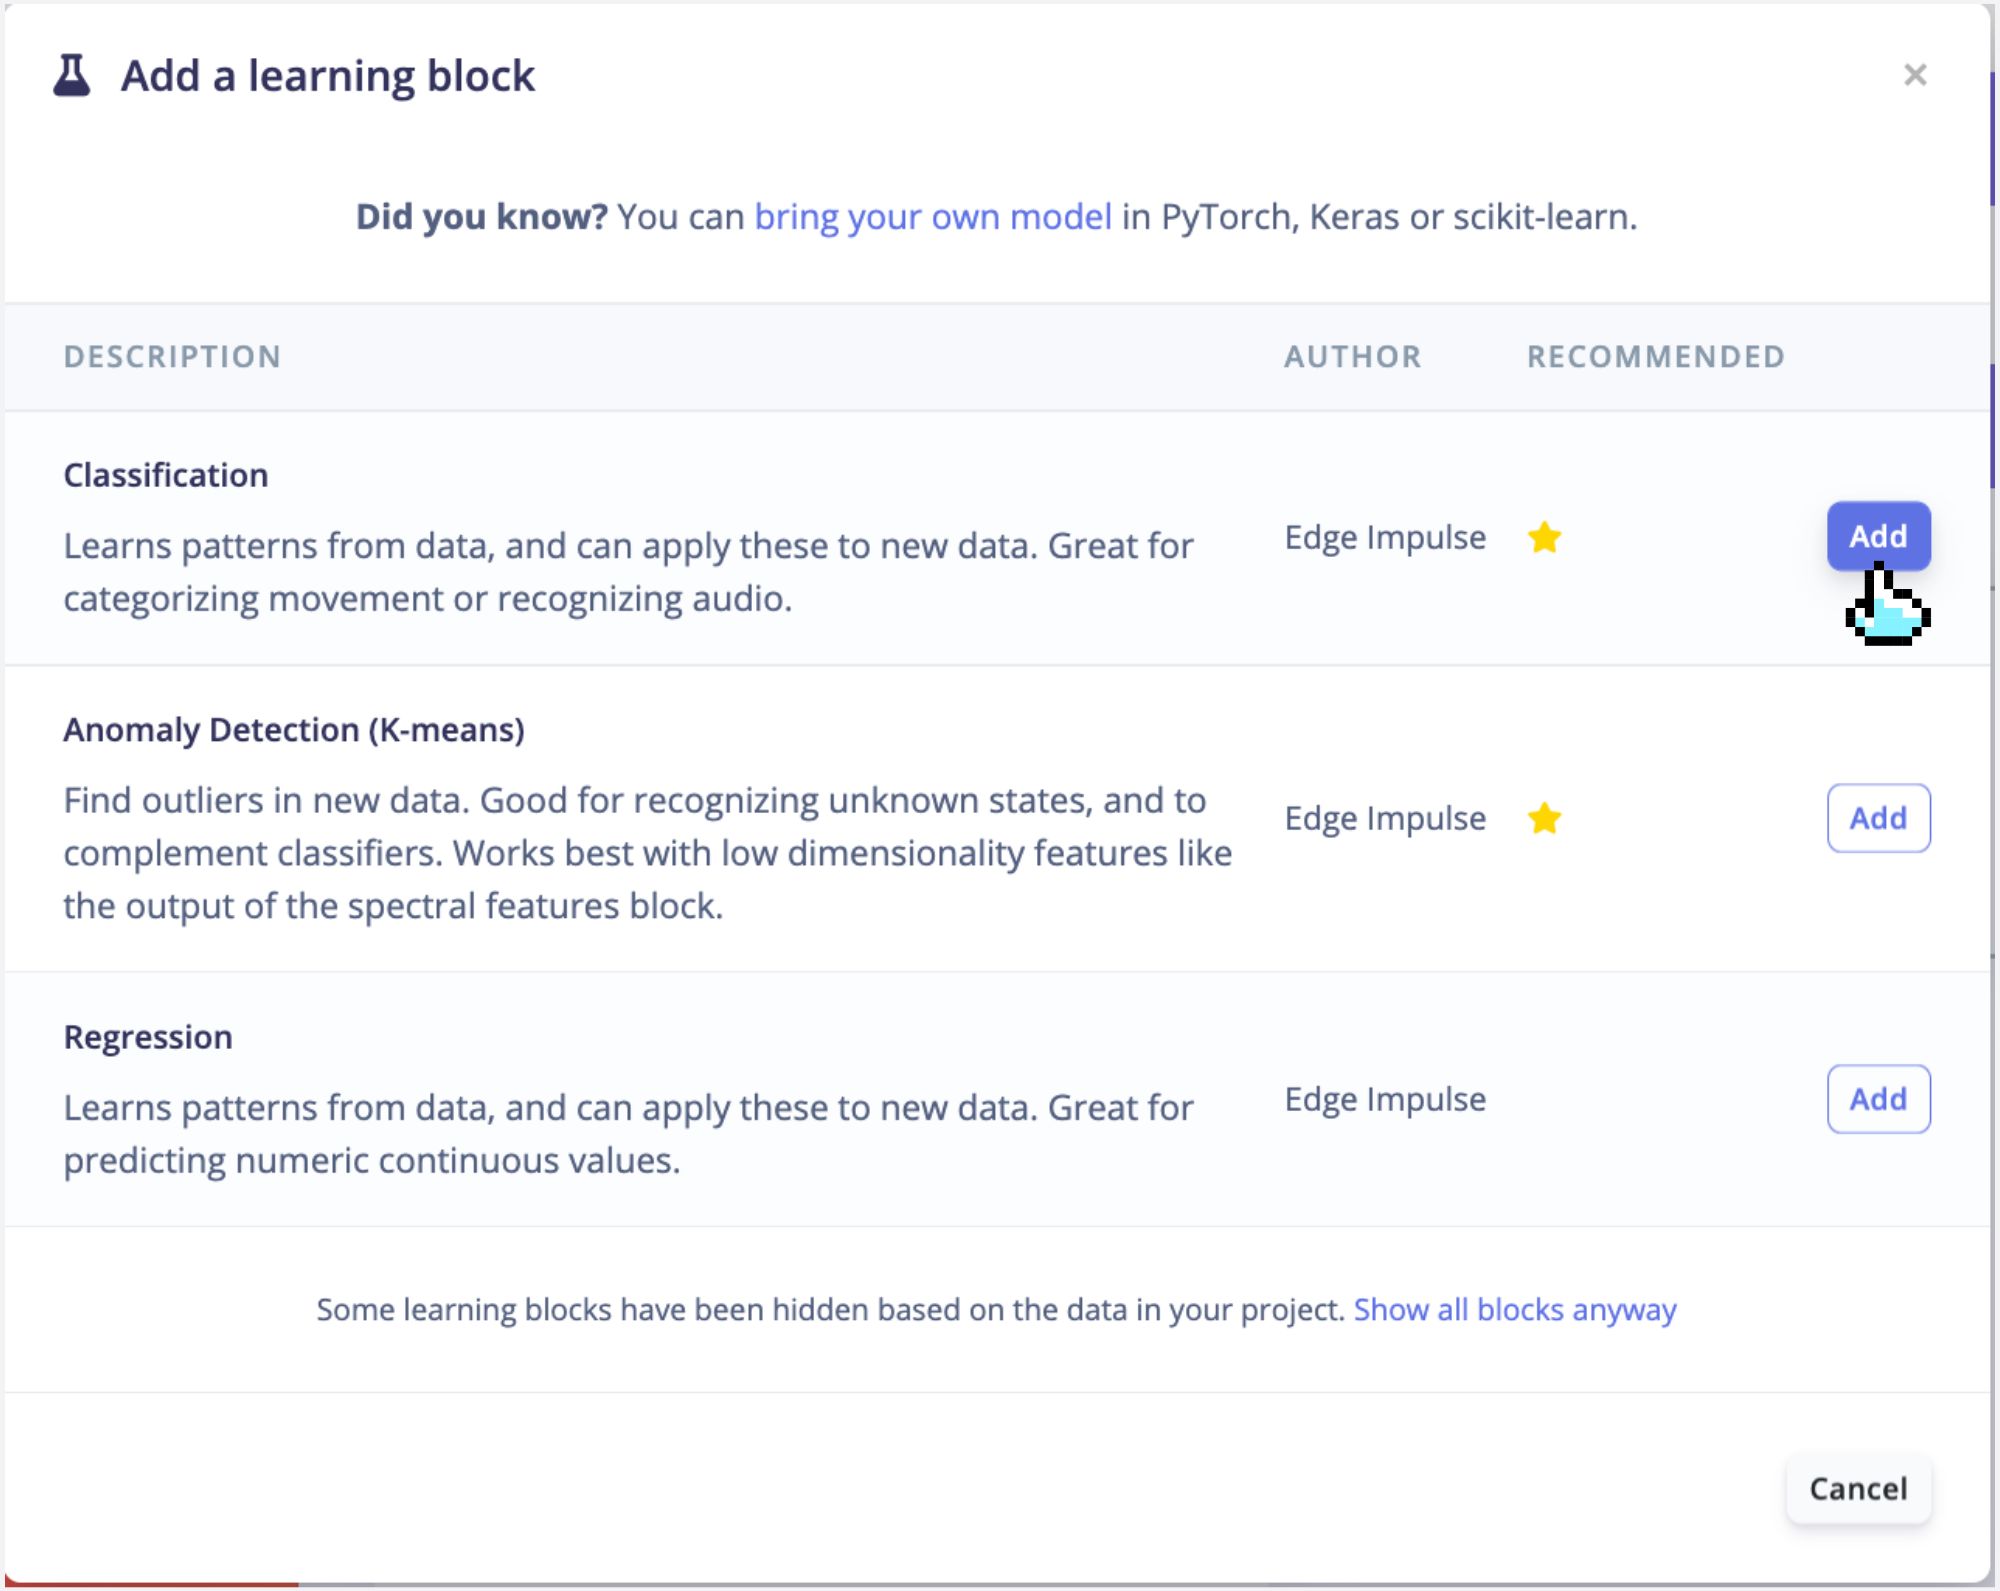
Click the "Add Learning Block" button and select **Classification** in the pop-up window as shown below to match our motion analysis task type.
<!--  -->
The interface of Impulse design after addition is shown in the figure below, and now the machine learning pipeline has been built.
<!--  -->
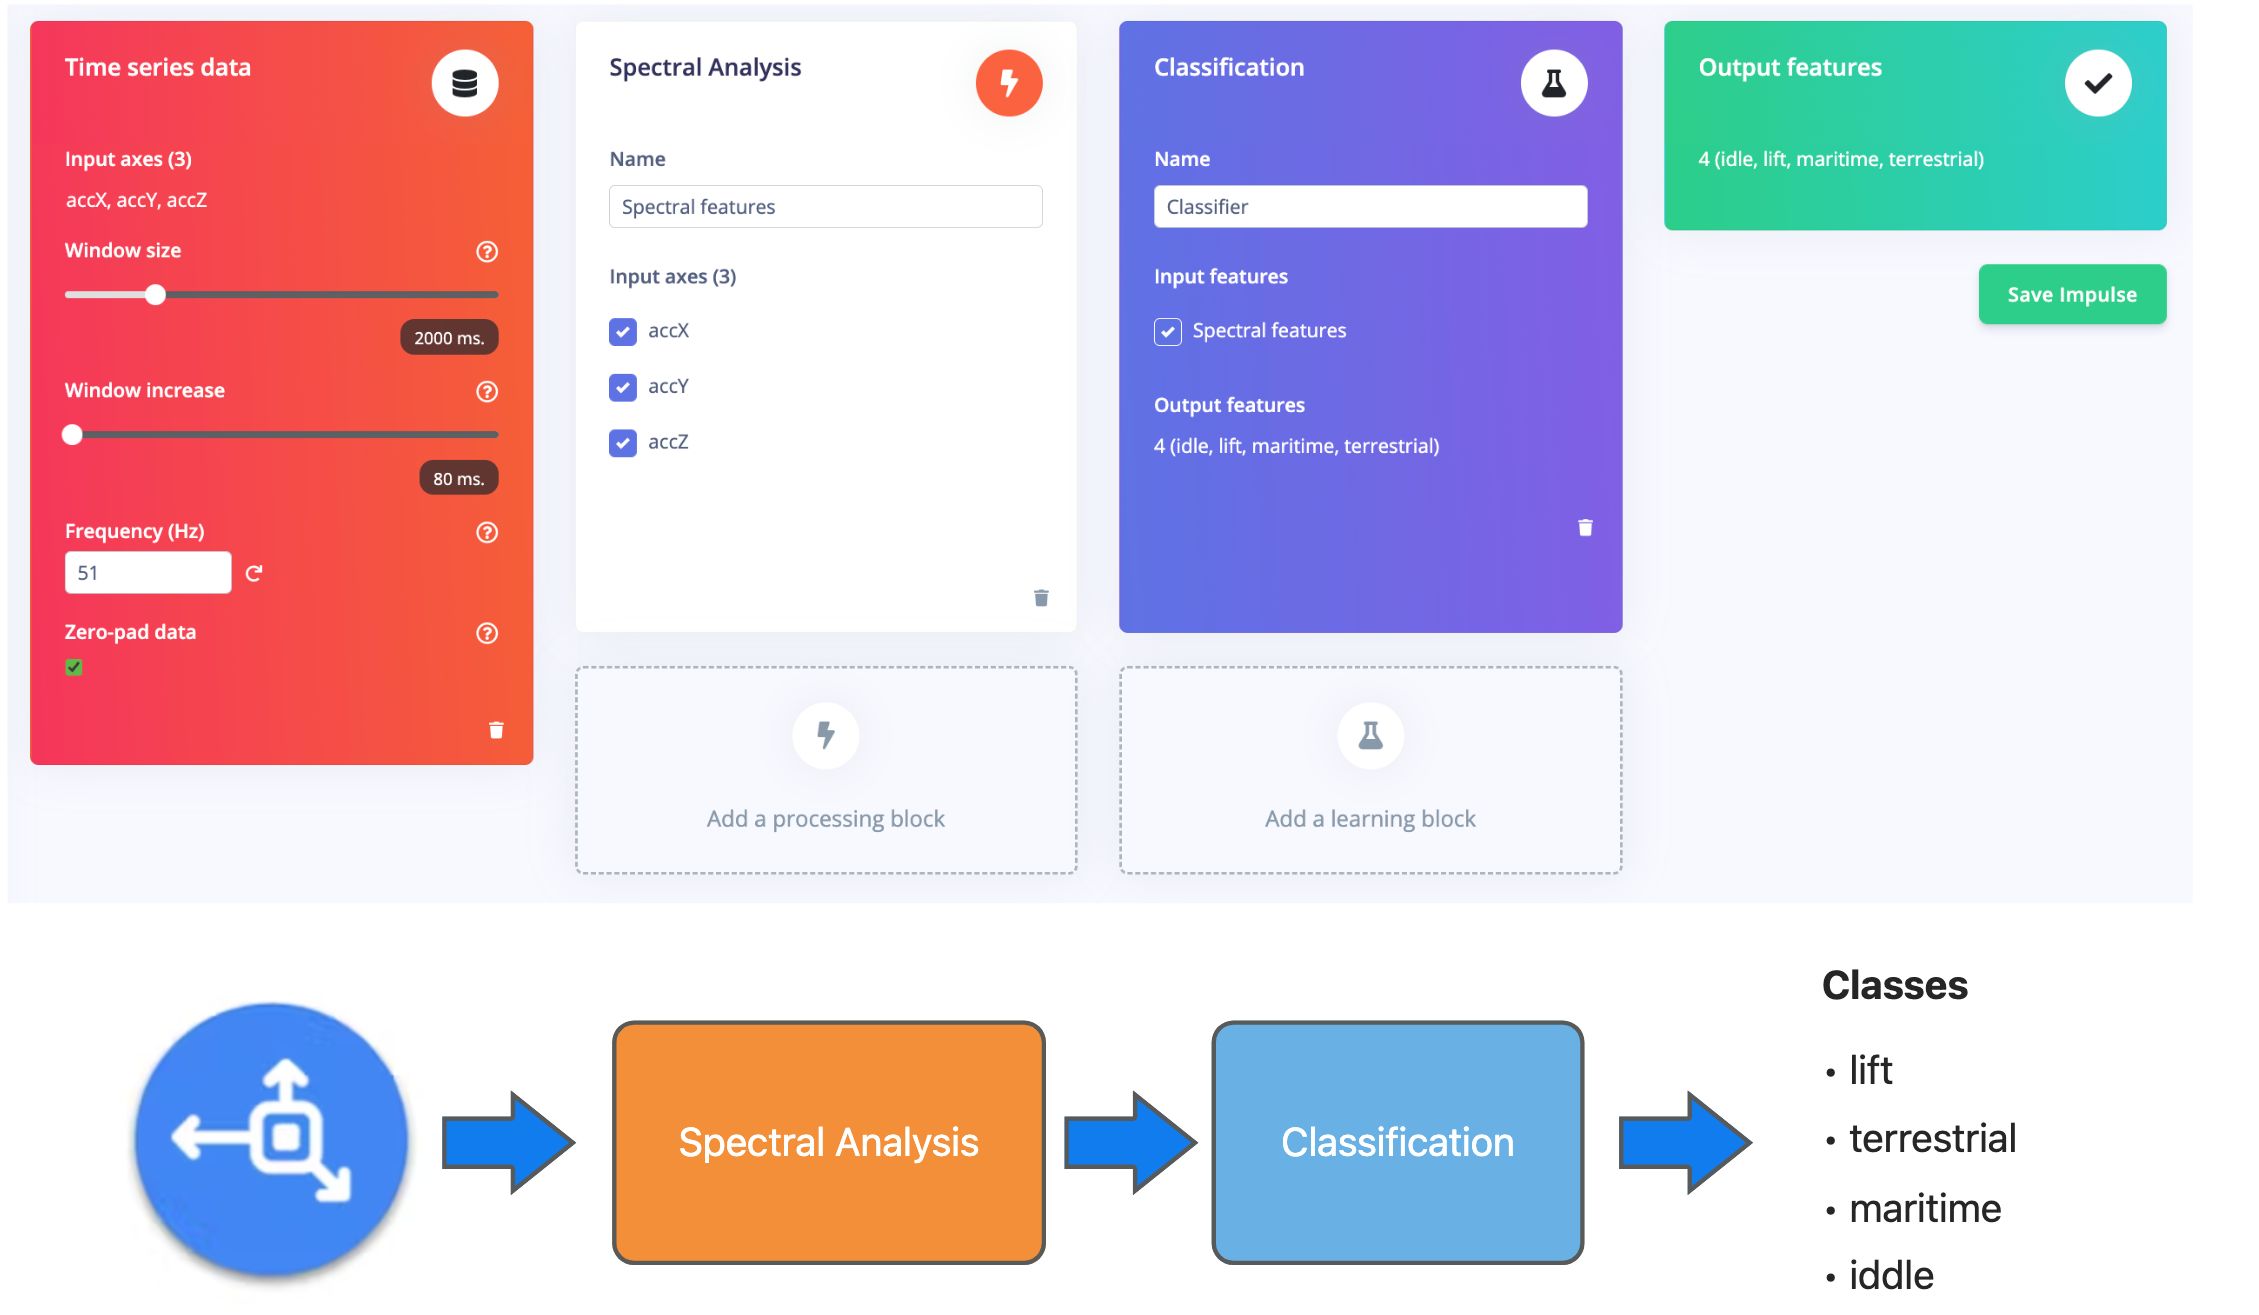
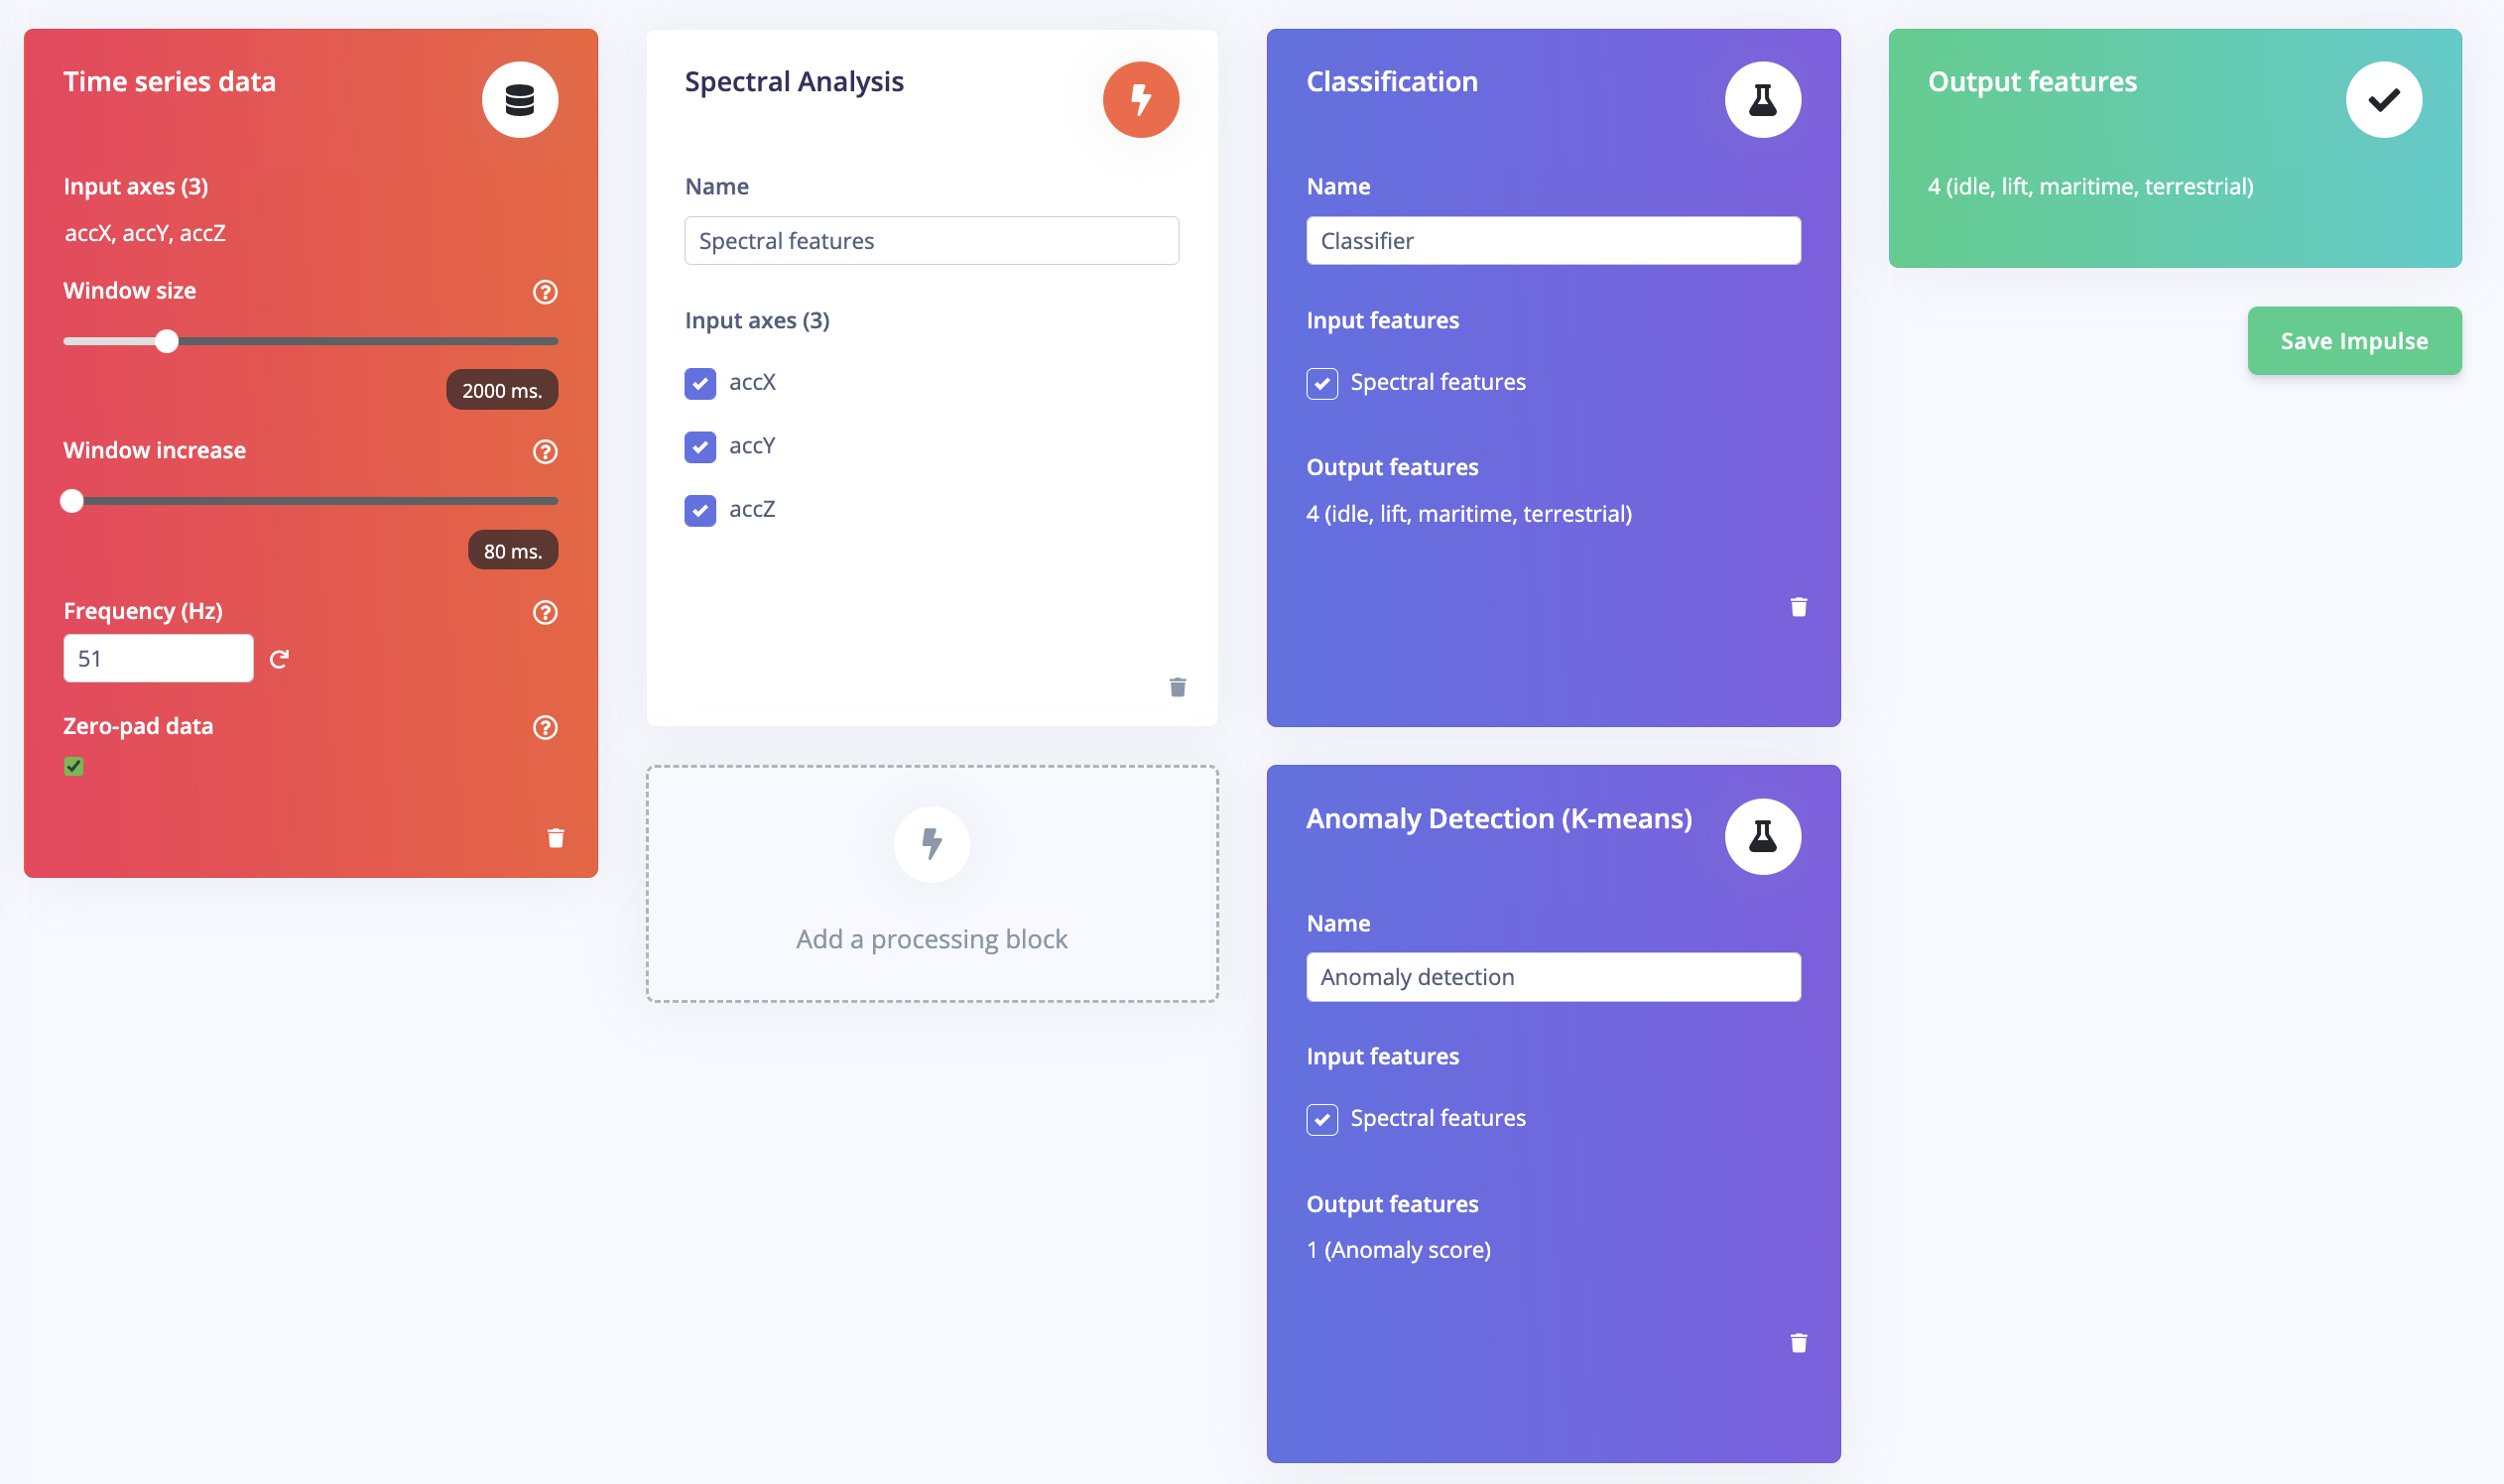
In addition, we can also use a second model - K-means, which can be used for anomaly detection. If we imagine that we can treat our known classes as clusters, then any sample that does not fit into it might be an anomaly (for example, a container falling into the sea when the ship is at sea).

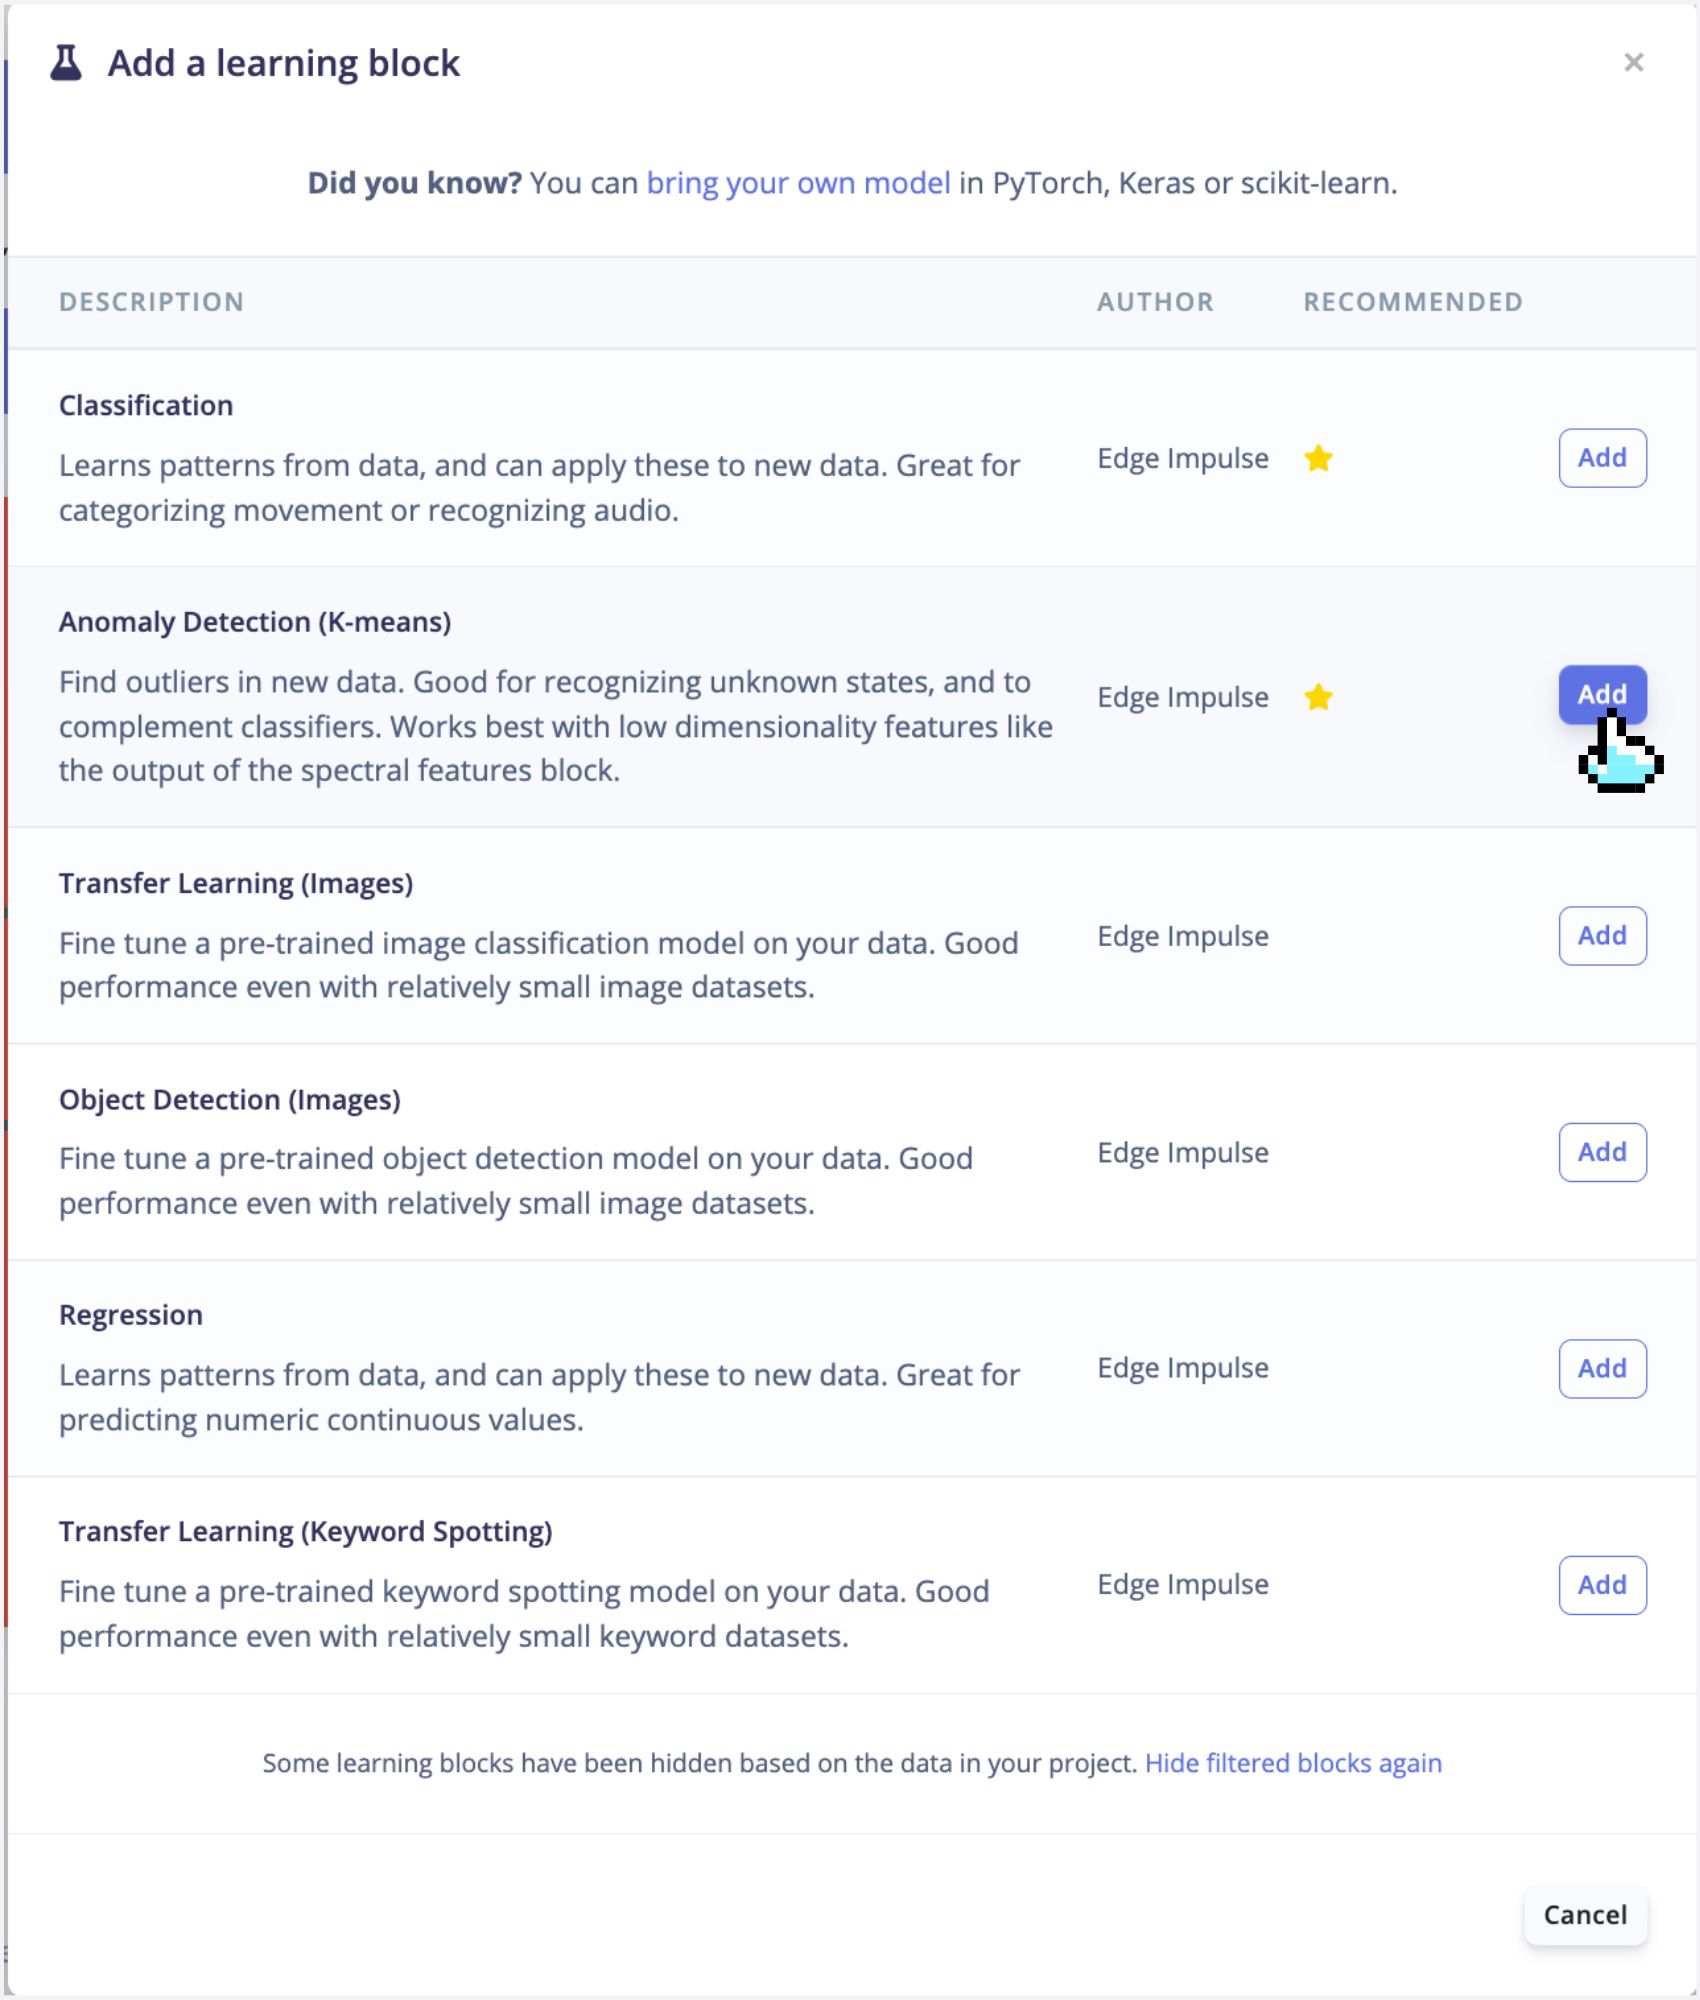
For this, we can use the same input tensor entering the NN classifier as the input to the K-means model:

Click the "Add Learning Block" button again and select **Anomaly Detection (K-means)** in the pop-up window below.
<!--  -->

The final Impulse design is as shown in the figure below, click the **Save Impulse** button on the far right.
<!--  -->
### 4.2.4.6 Generating features
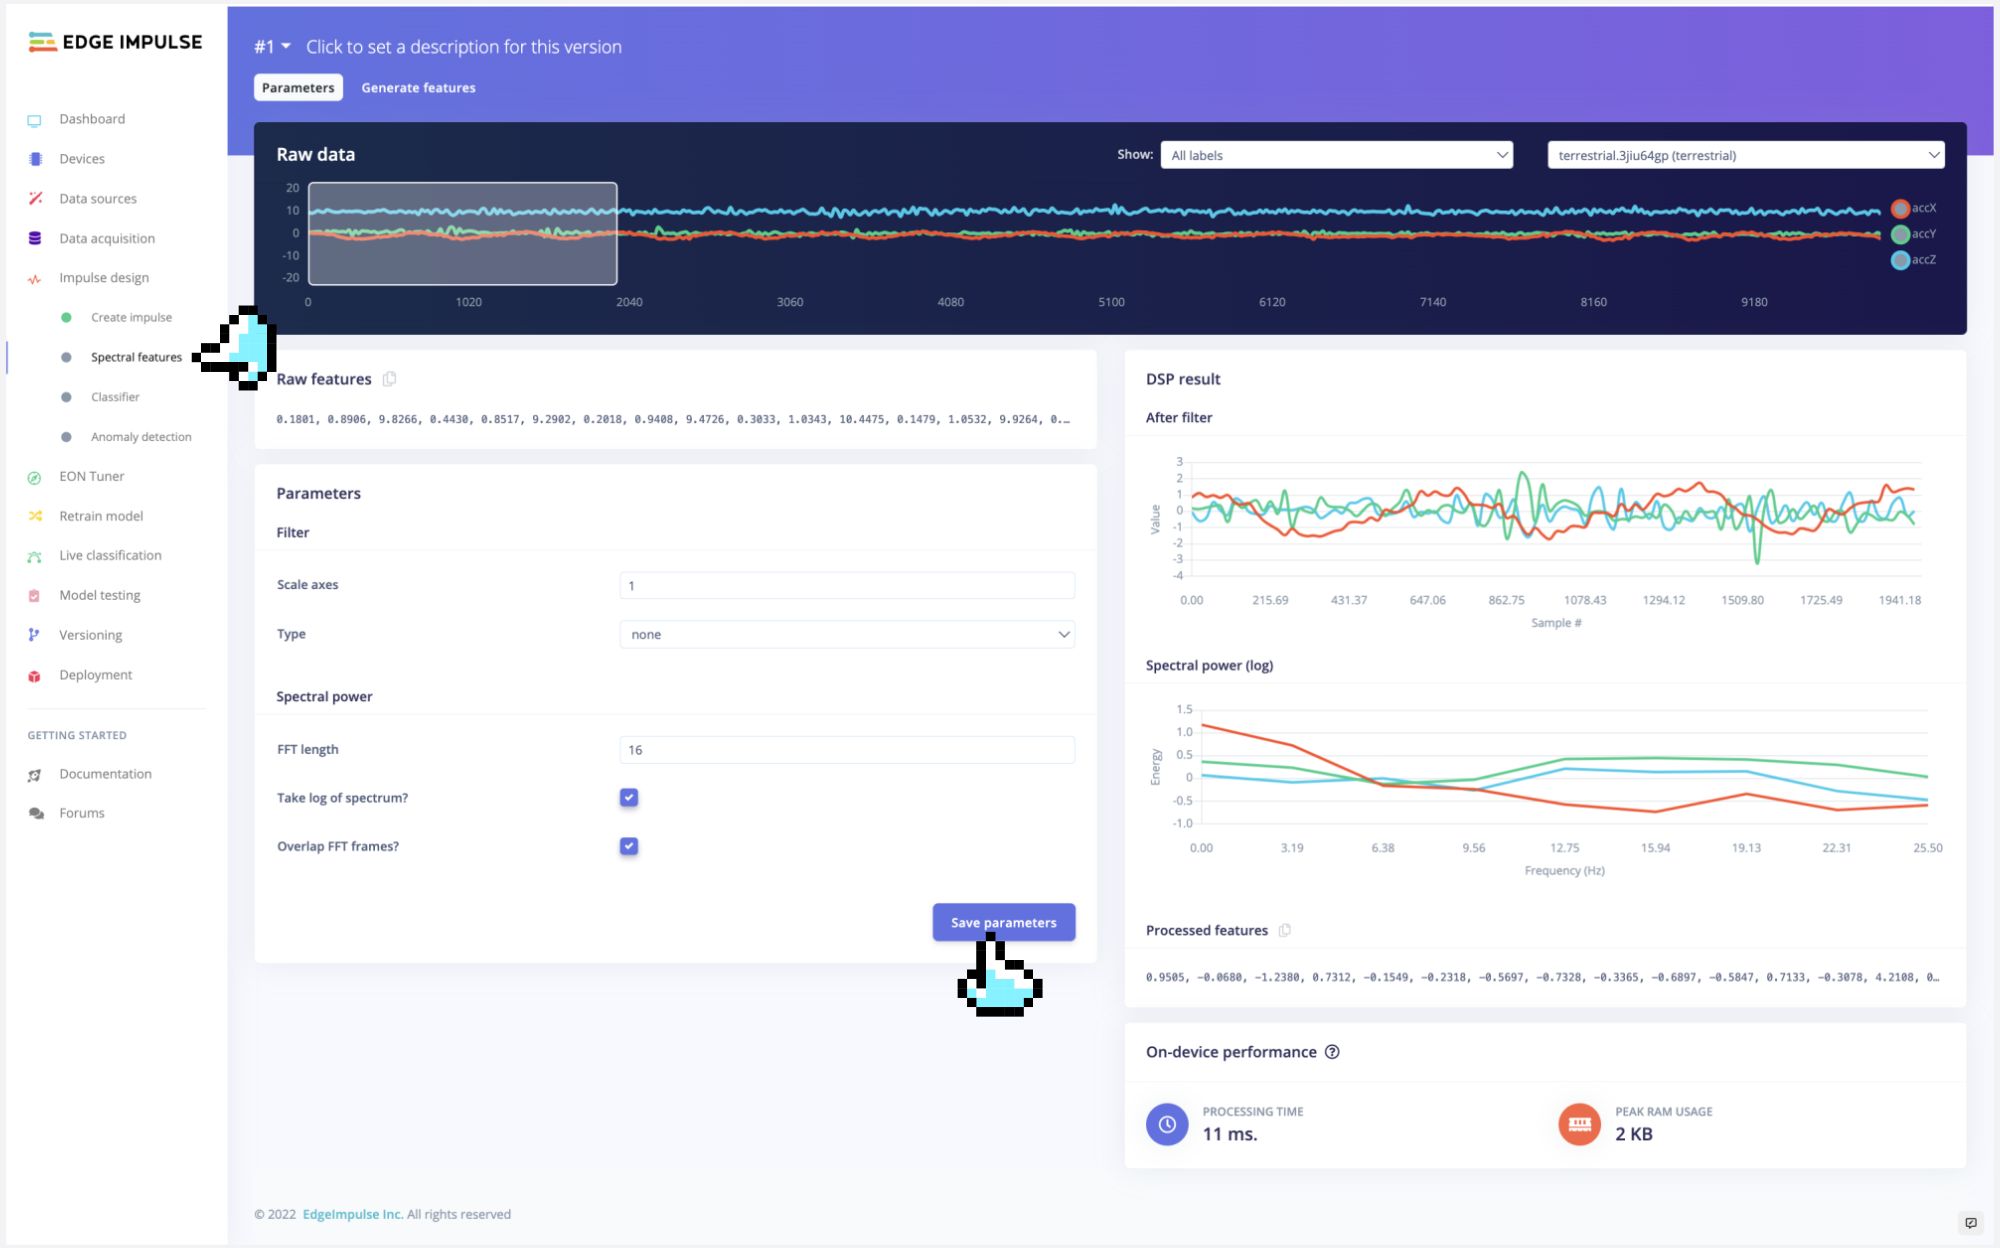
At this point in our project, we have defined the pre-processing method and the model designed. Now, it is time to have the job done. First, let's take the raw data (time-series type) and convert it to tabular data. Go to the `Spectral Features` tab, select `Save Parameters`,
<!--  -->
and at the top menu, select `Generate Features` option and `Generate Features` button:
<!-- 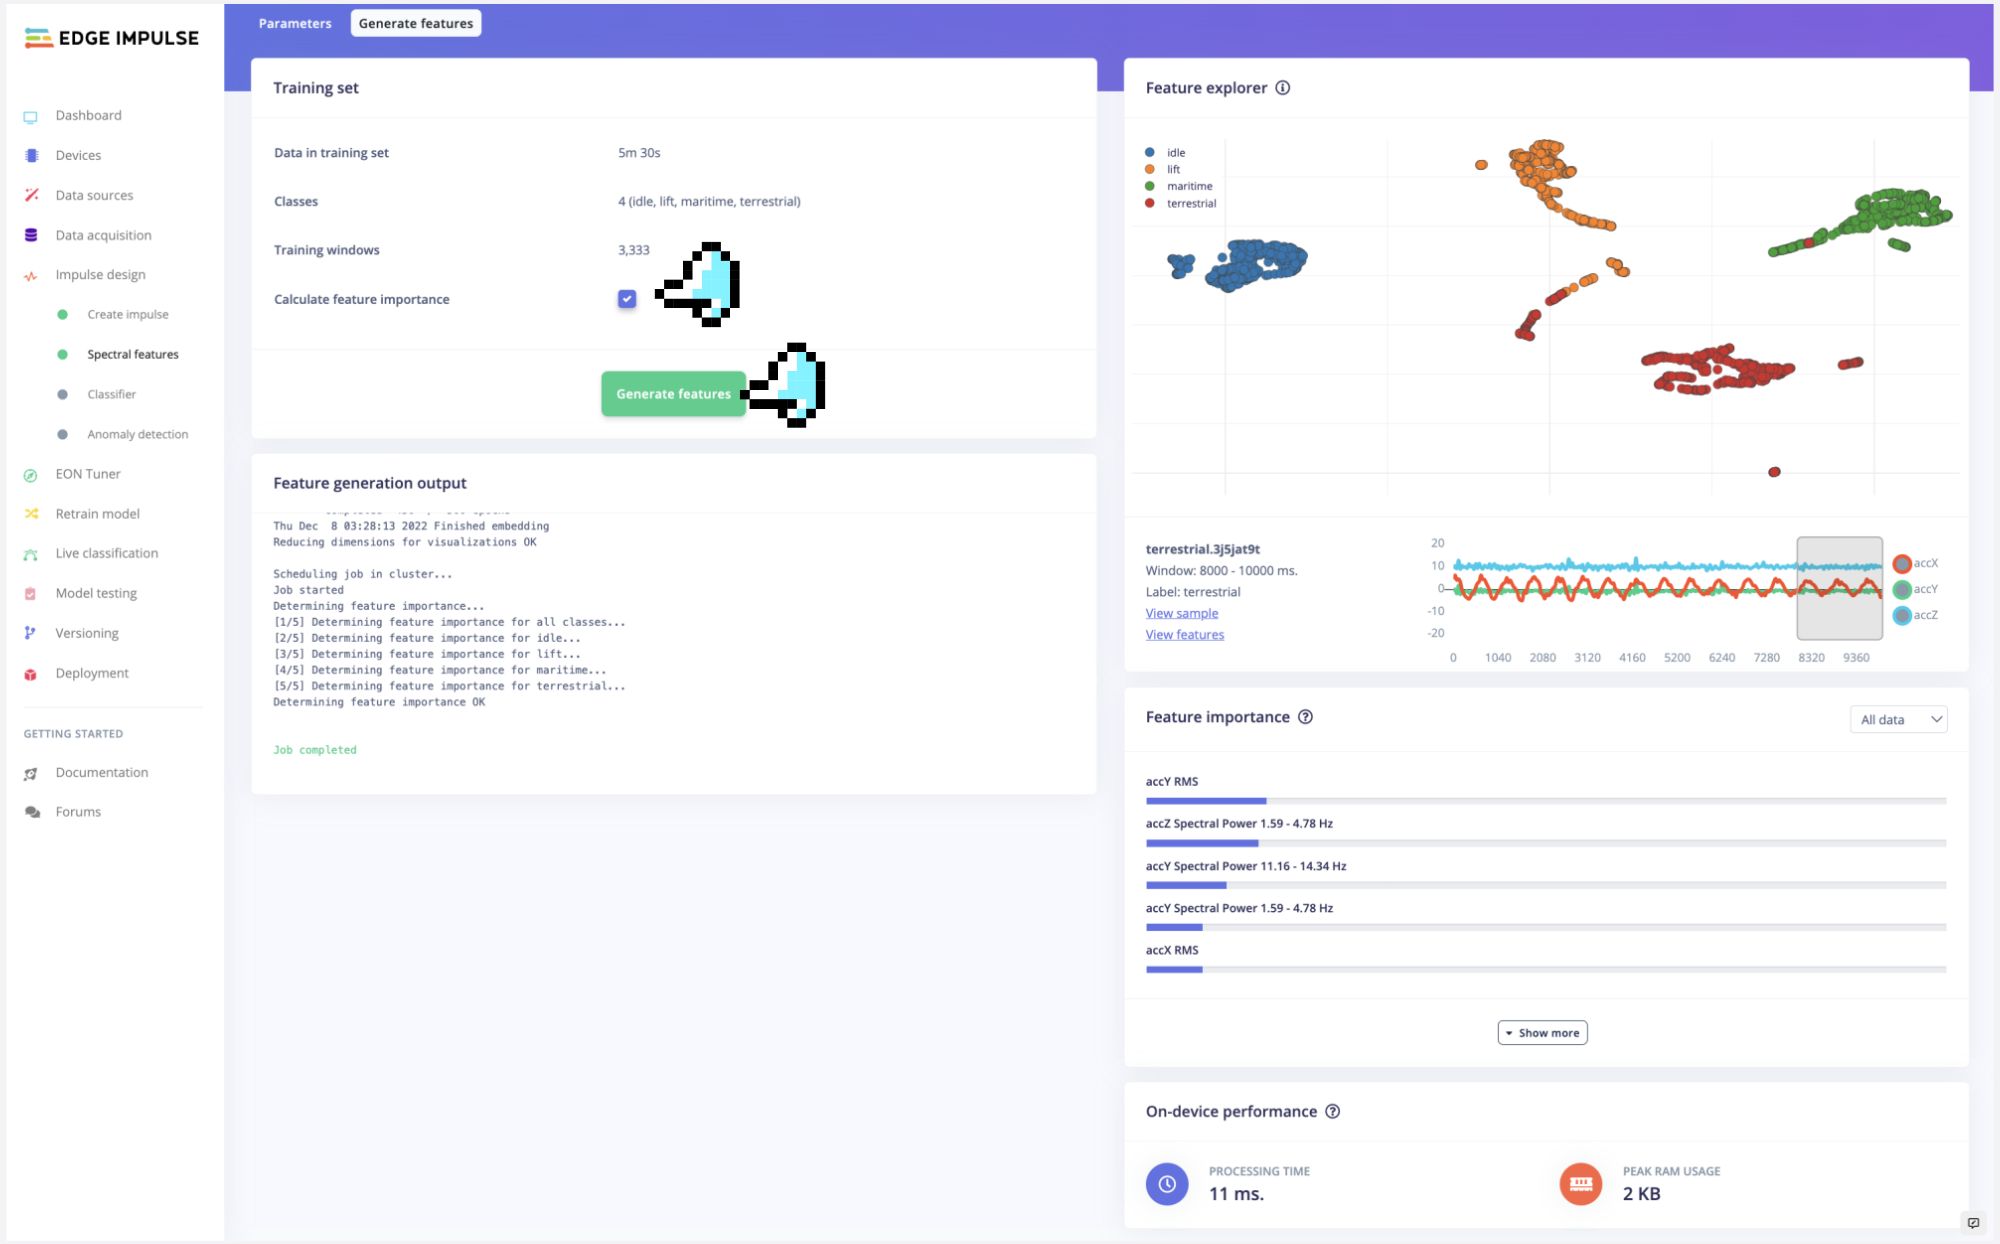 -->
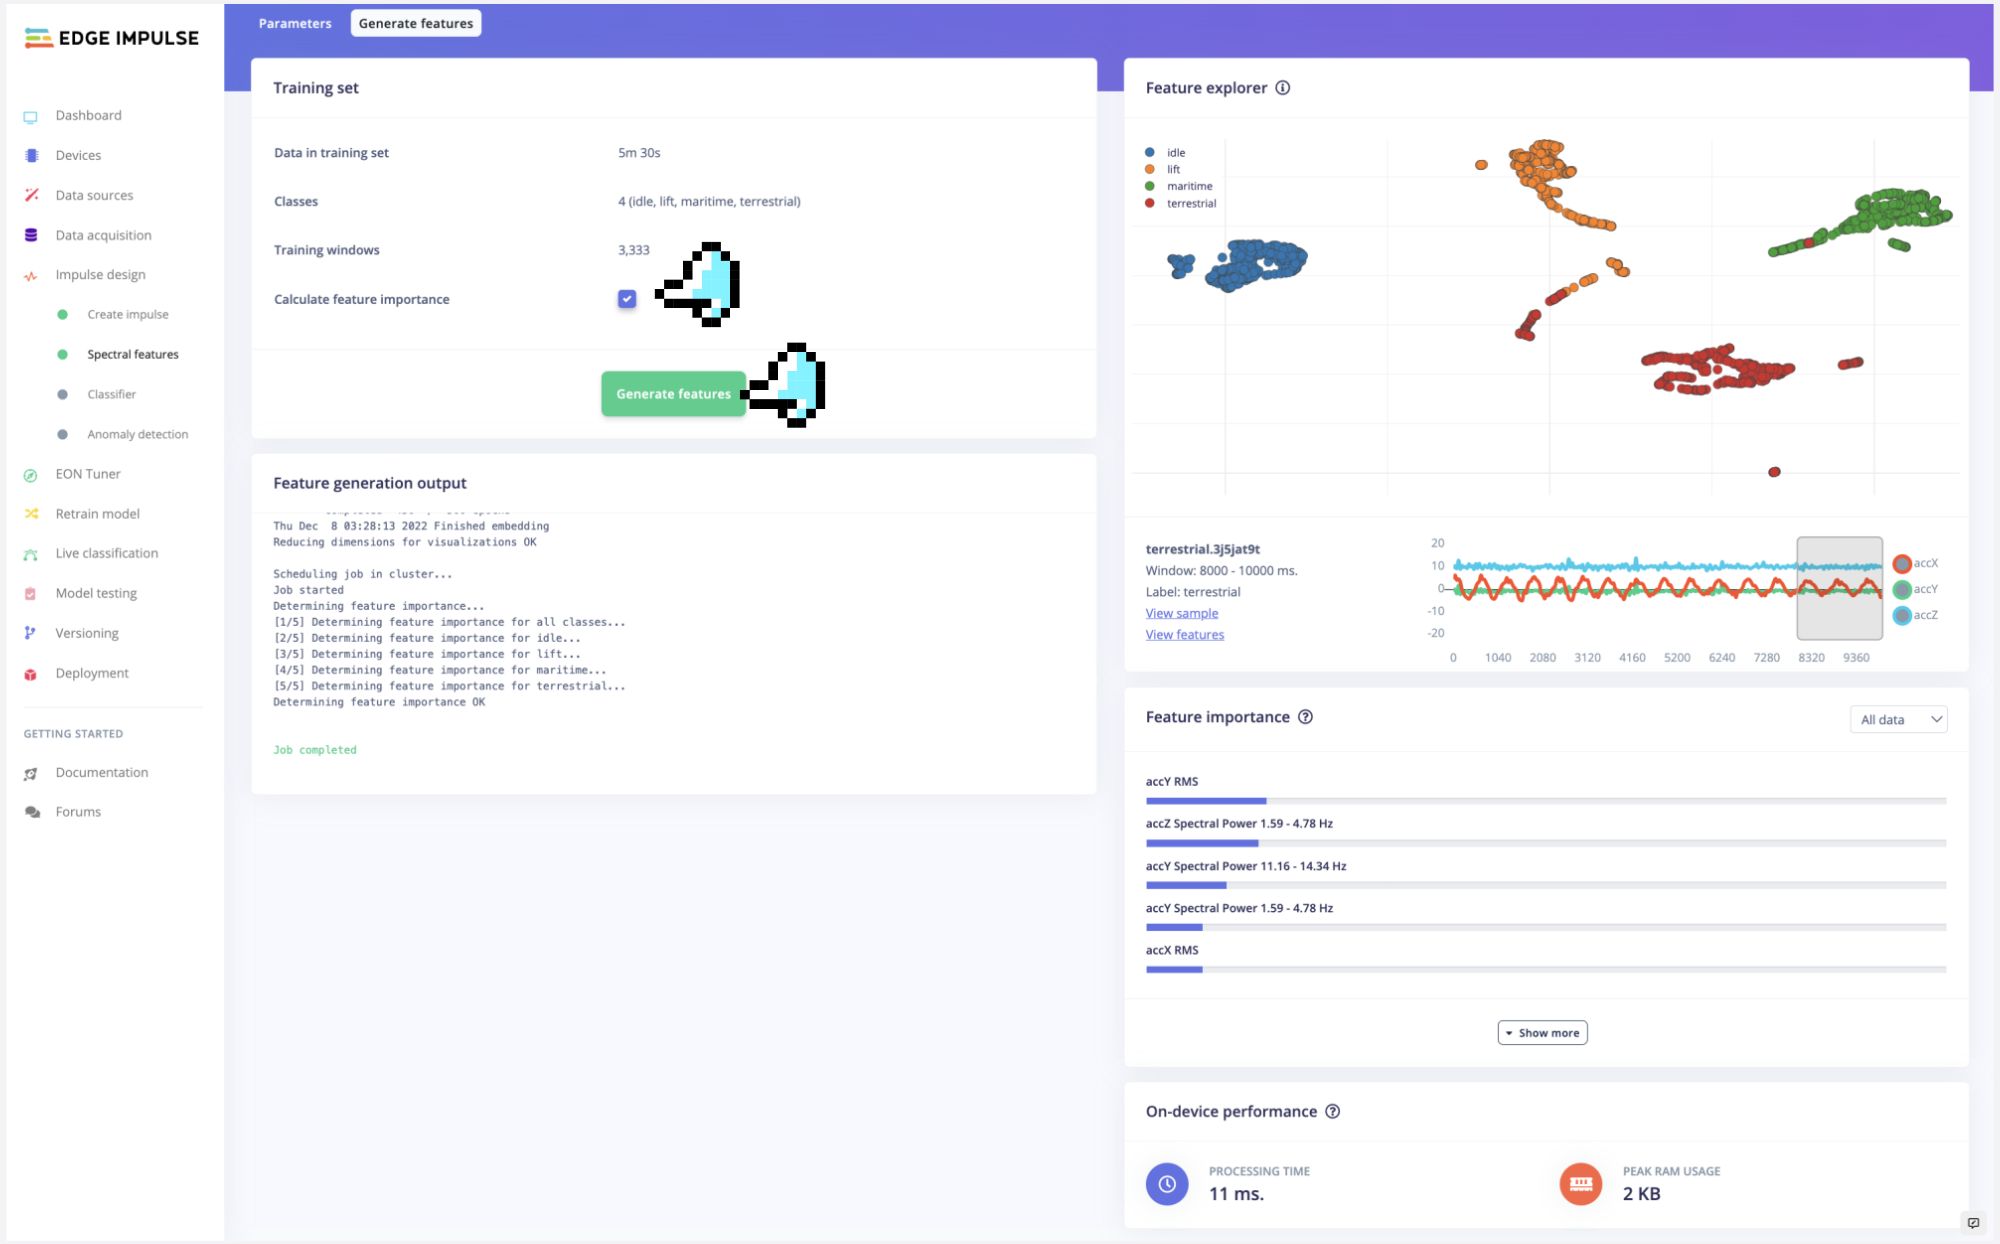
Each 2-second window data will be converted into one data point of 63 features. The Feature Explorer will show those data in 2D using [UMAP](https://umap-learn.readthedocs.io/en/latest/).
> Uniform Manifold Approximation and Projection (UMAP) is a dimension reduction technique that can be used for visualisation similarly to t-SNE, but also for general non-linear dimension reduction.
With the visualization, it is possible to verify that the classes present an excellent separation, which indicates that the classifier should work well.
> Optionally you can analyze how important each one of the features is for one class compared with other classes.
### 4.2.4.7 Training
Our model has four layers, as shown below:

As hyperparameters, we will use a Learning Rate of 0.005 and 20% of data for validation for 30 epochs.

After training, we can see that the accuracy is 100%.

If a K-means block for anomaly detection has been added during model design, an additional section for `Anomaly Detection` will appear under the `Impulse Design` column on the left, as shown in the image below. Once inside the Anomaly Detection section, click `[Select Suggested Axes]`, and the system will automatically make selections based on previously calculated important features. Then click on the `[Start Training]` button to begin the training. Results will be output in the Anomaly Explorer on the right after completion.
<!-- 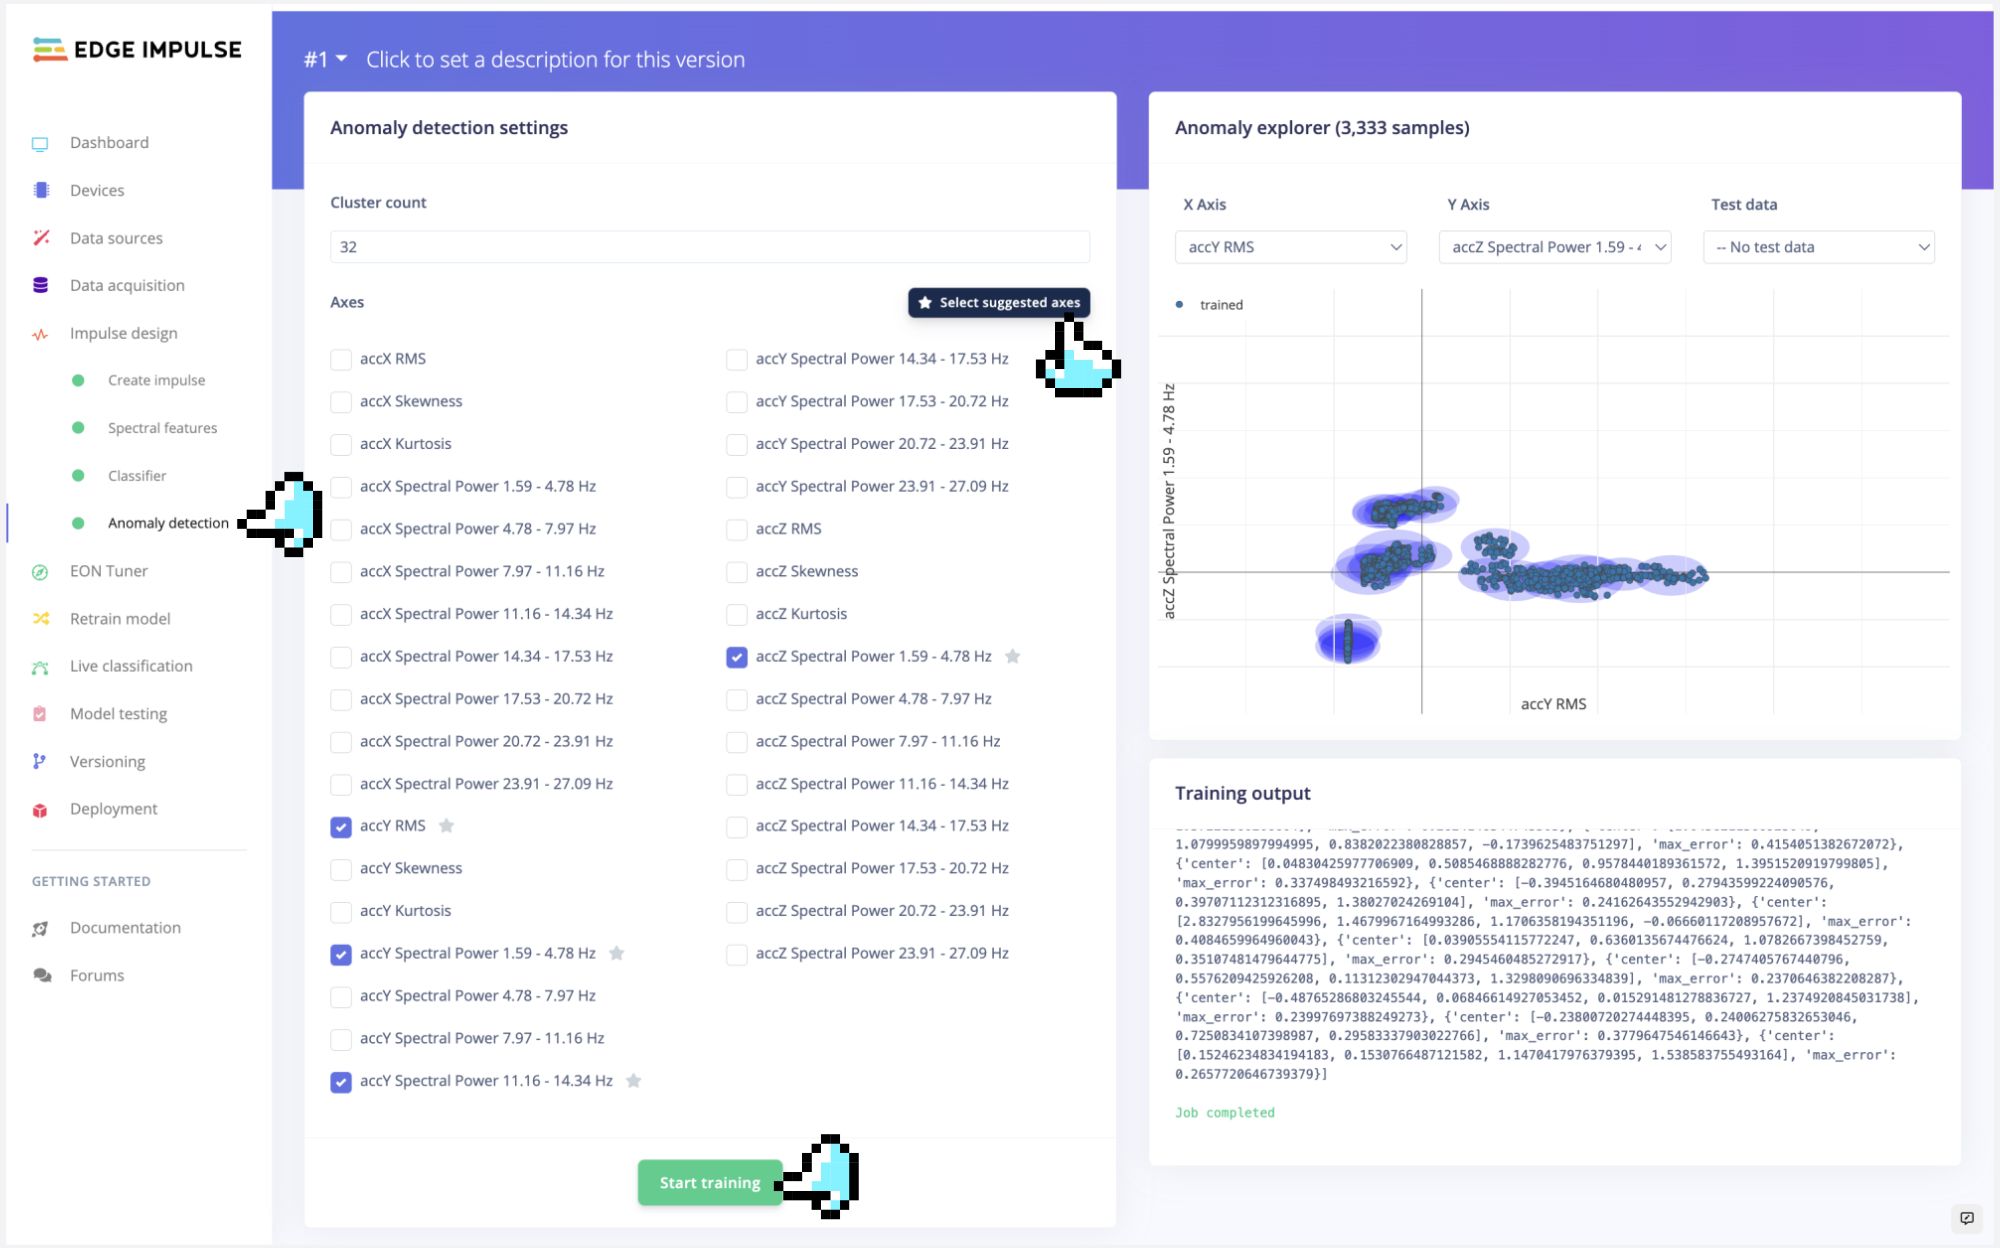 -->
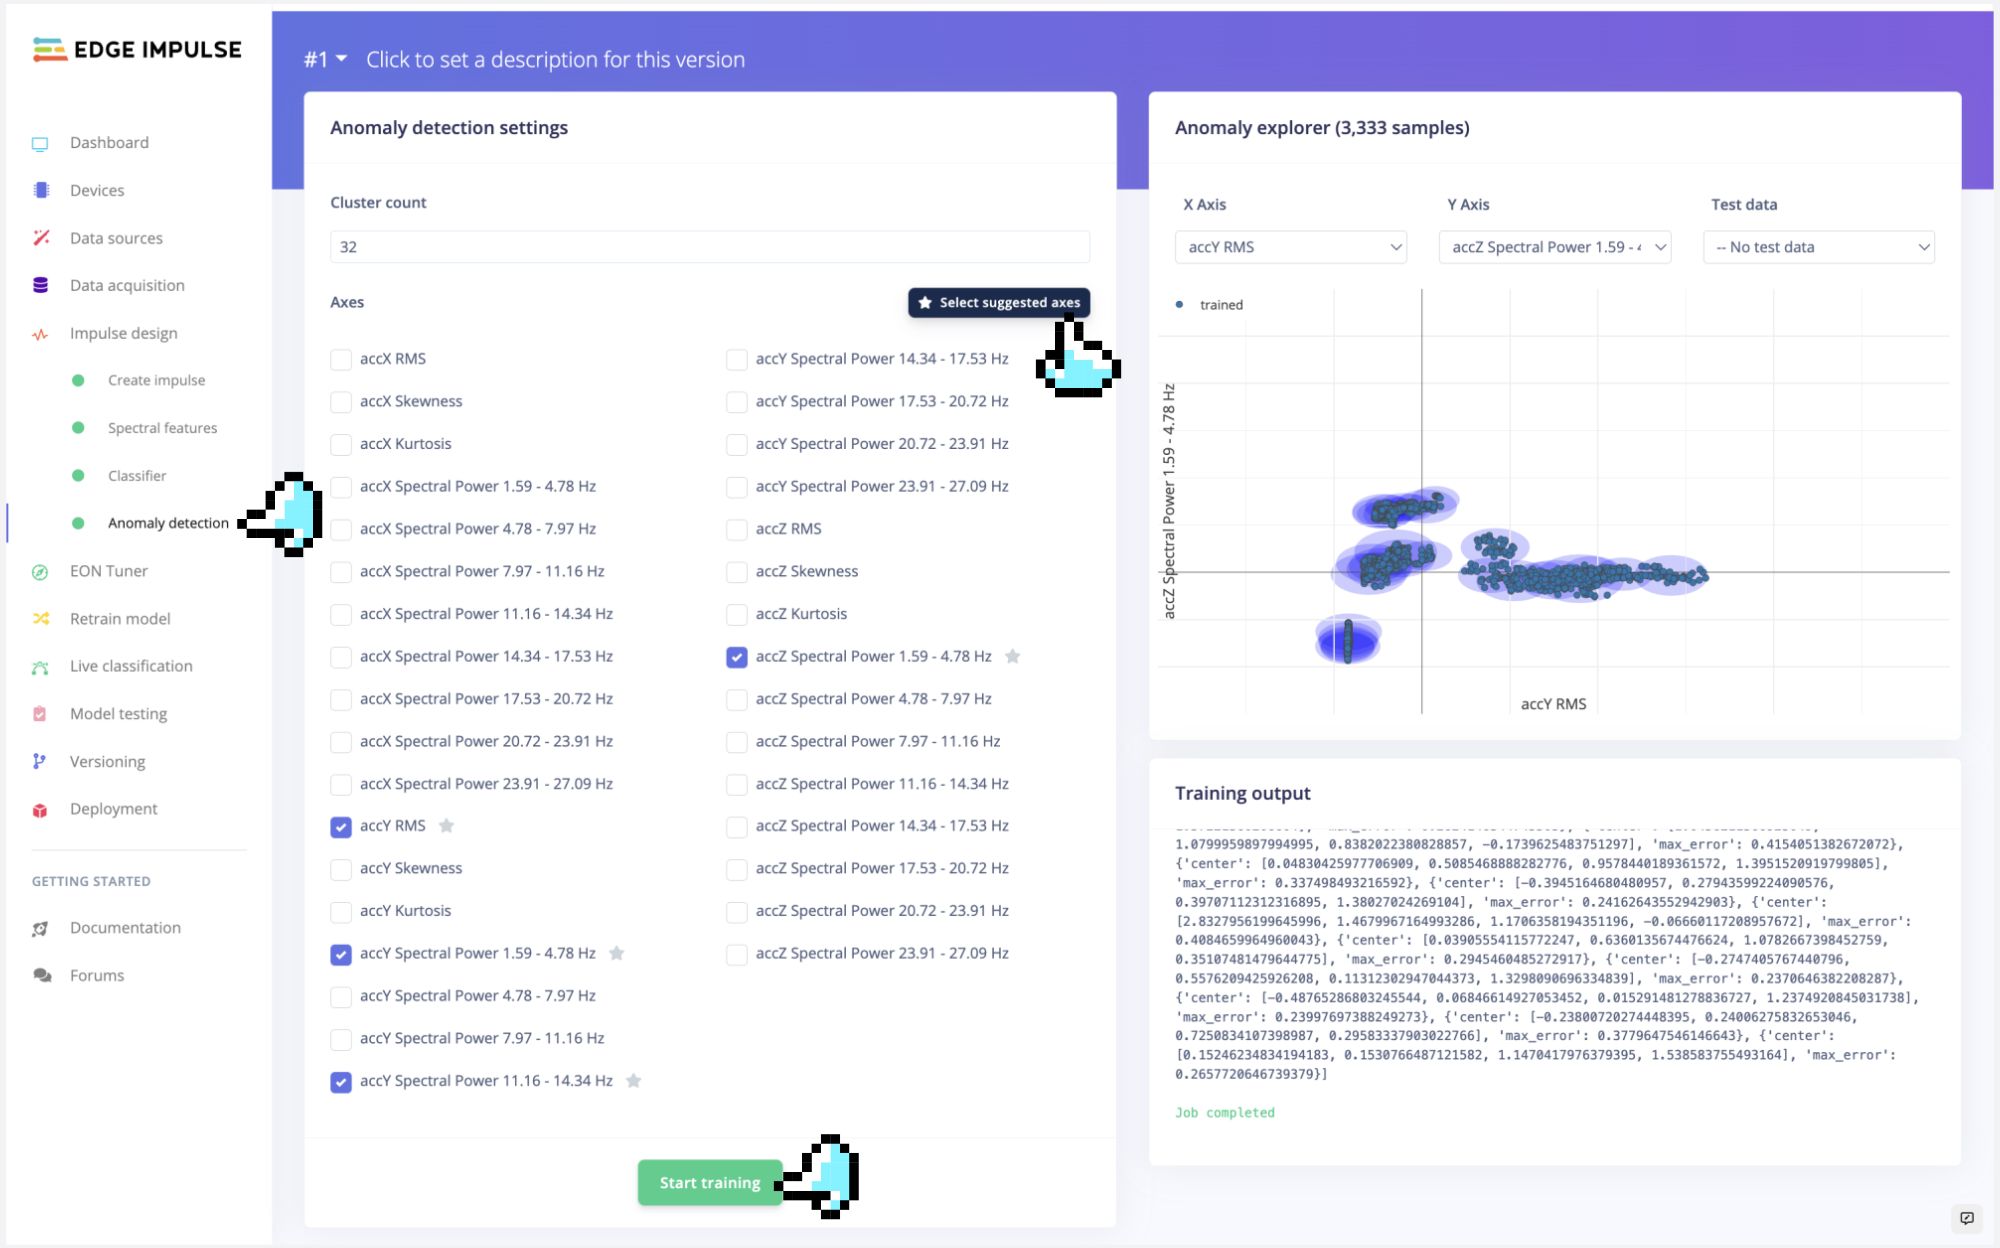
At this point, we have completed the basic machine learning training process.
### 4.2.4.8 Testing
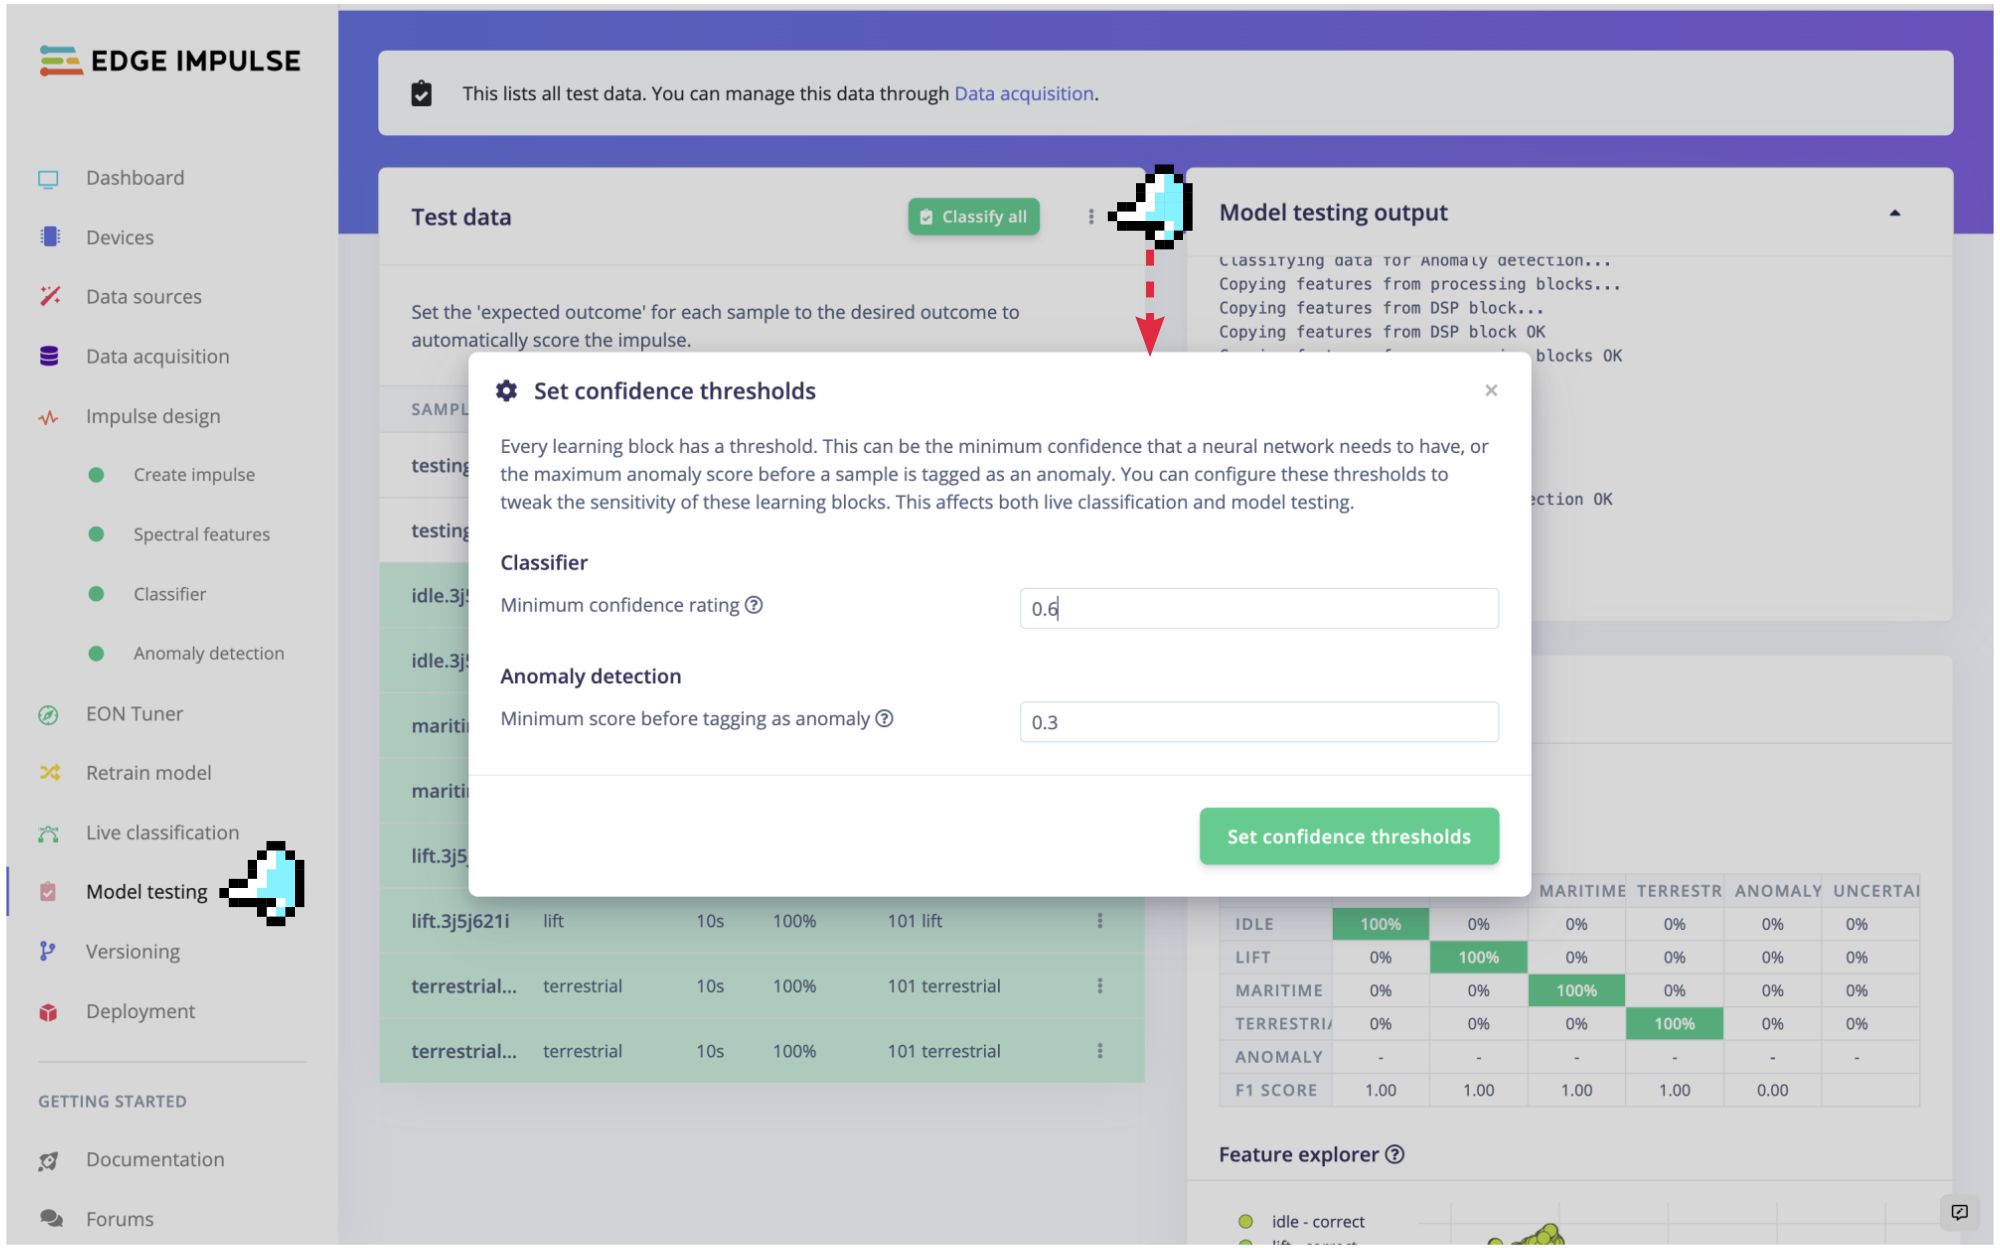
Using the 20% of data set aside during the data collection phase, we can verify the model's performance with unknown data. As shown in the image below, click on the `Model Testing` section on the left side of the Edge Impulse interface. Next to the `[Classify All]` button, there is an icon with three dots, click on it to open the **Set Confidence Thresholds** popup window. Here, you can set confidence thresholds for the results of the two learning blocks. We should define an acceptable threshold for results considered as anomalies. If a result is not 100% (which is often the case) but is within the threshold range, it is still usable.
<!-- 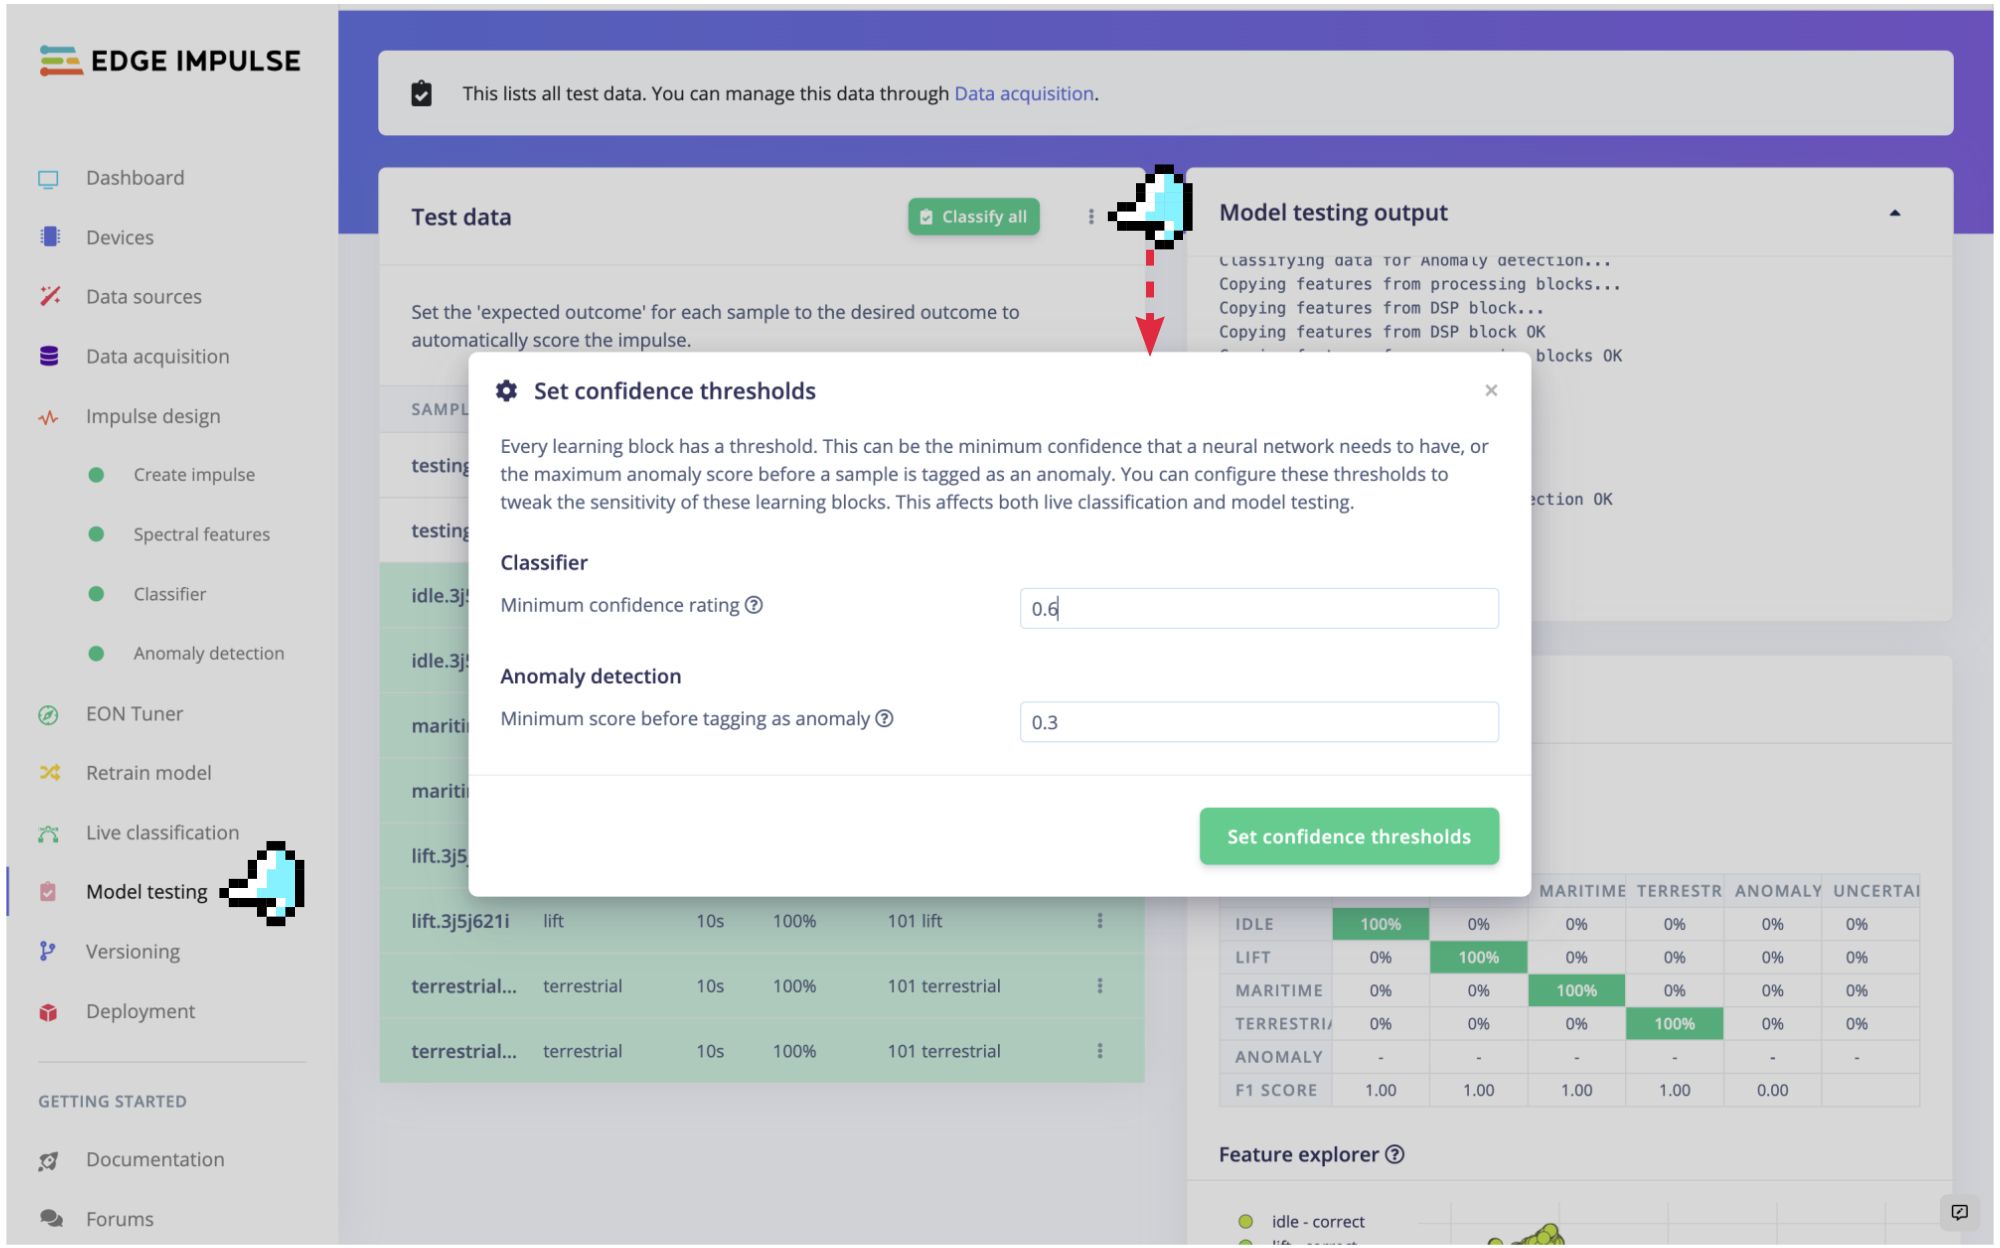 -->
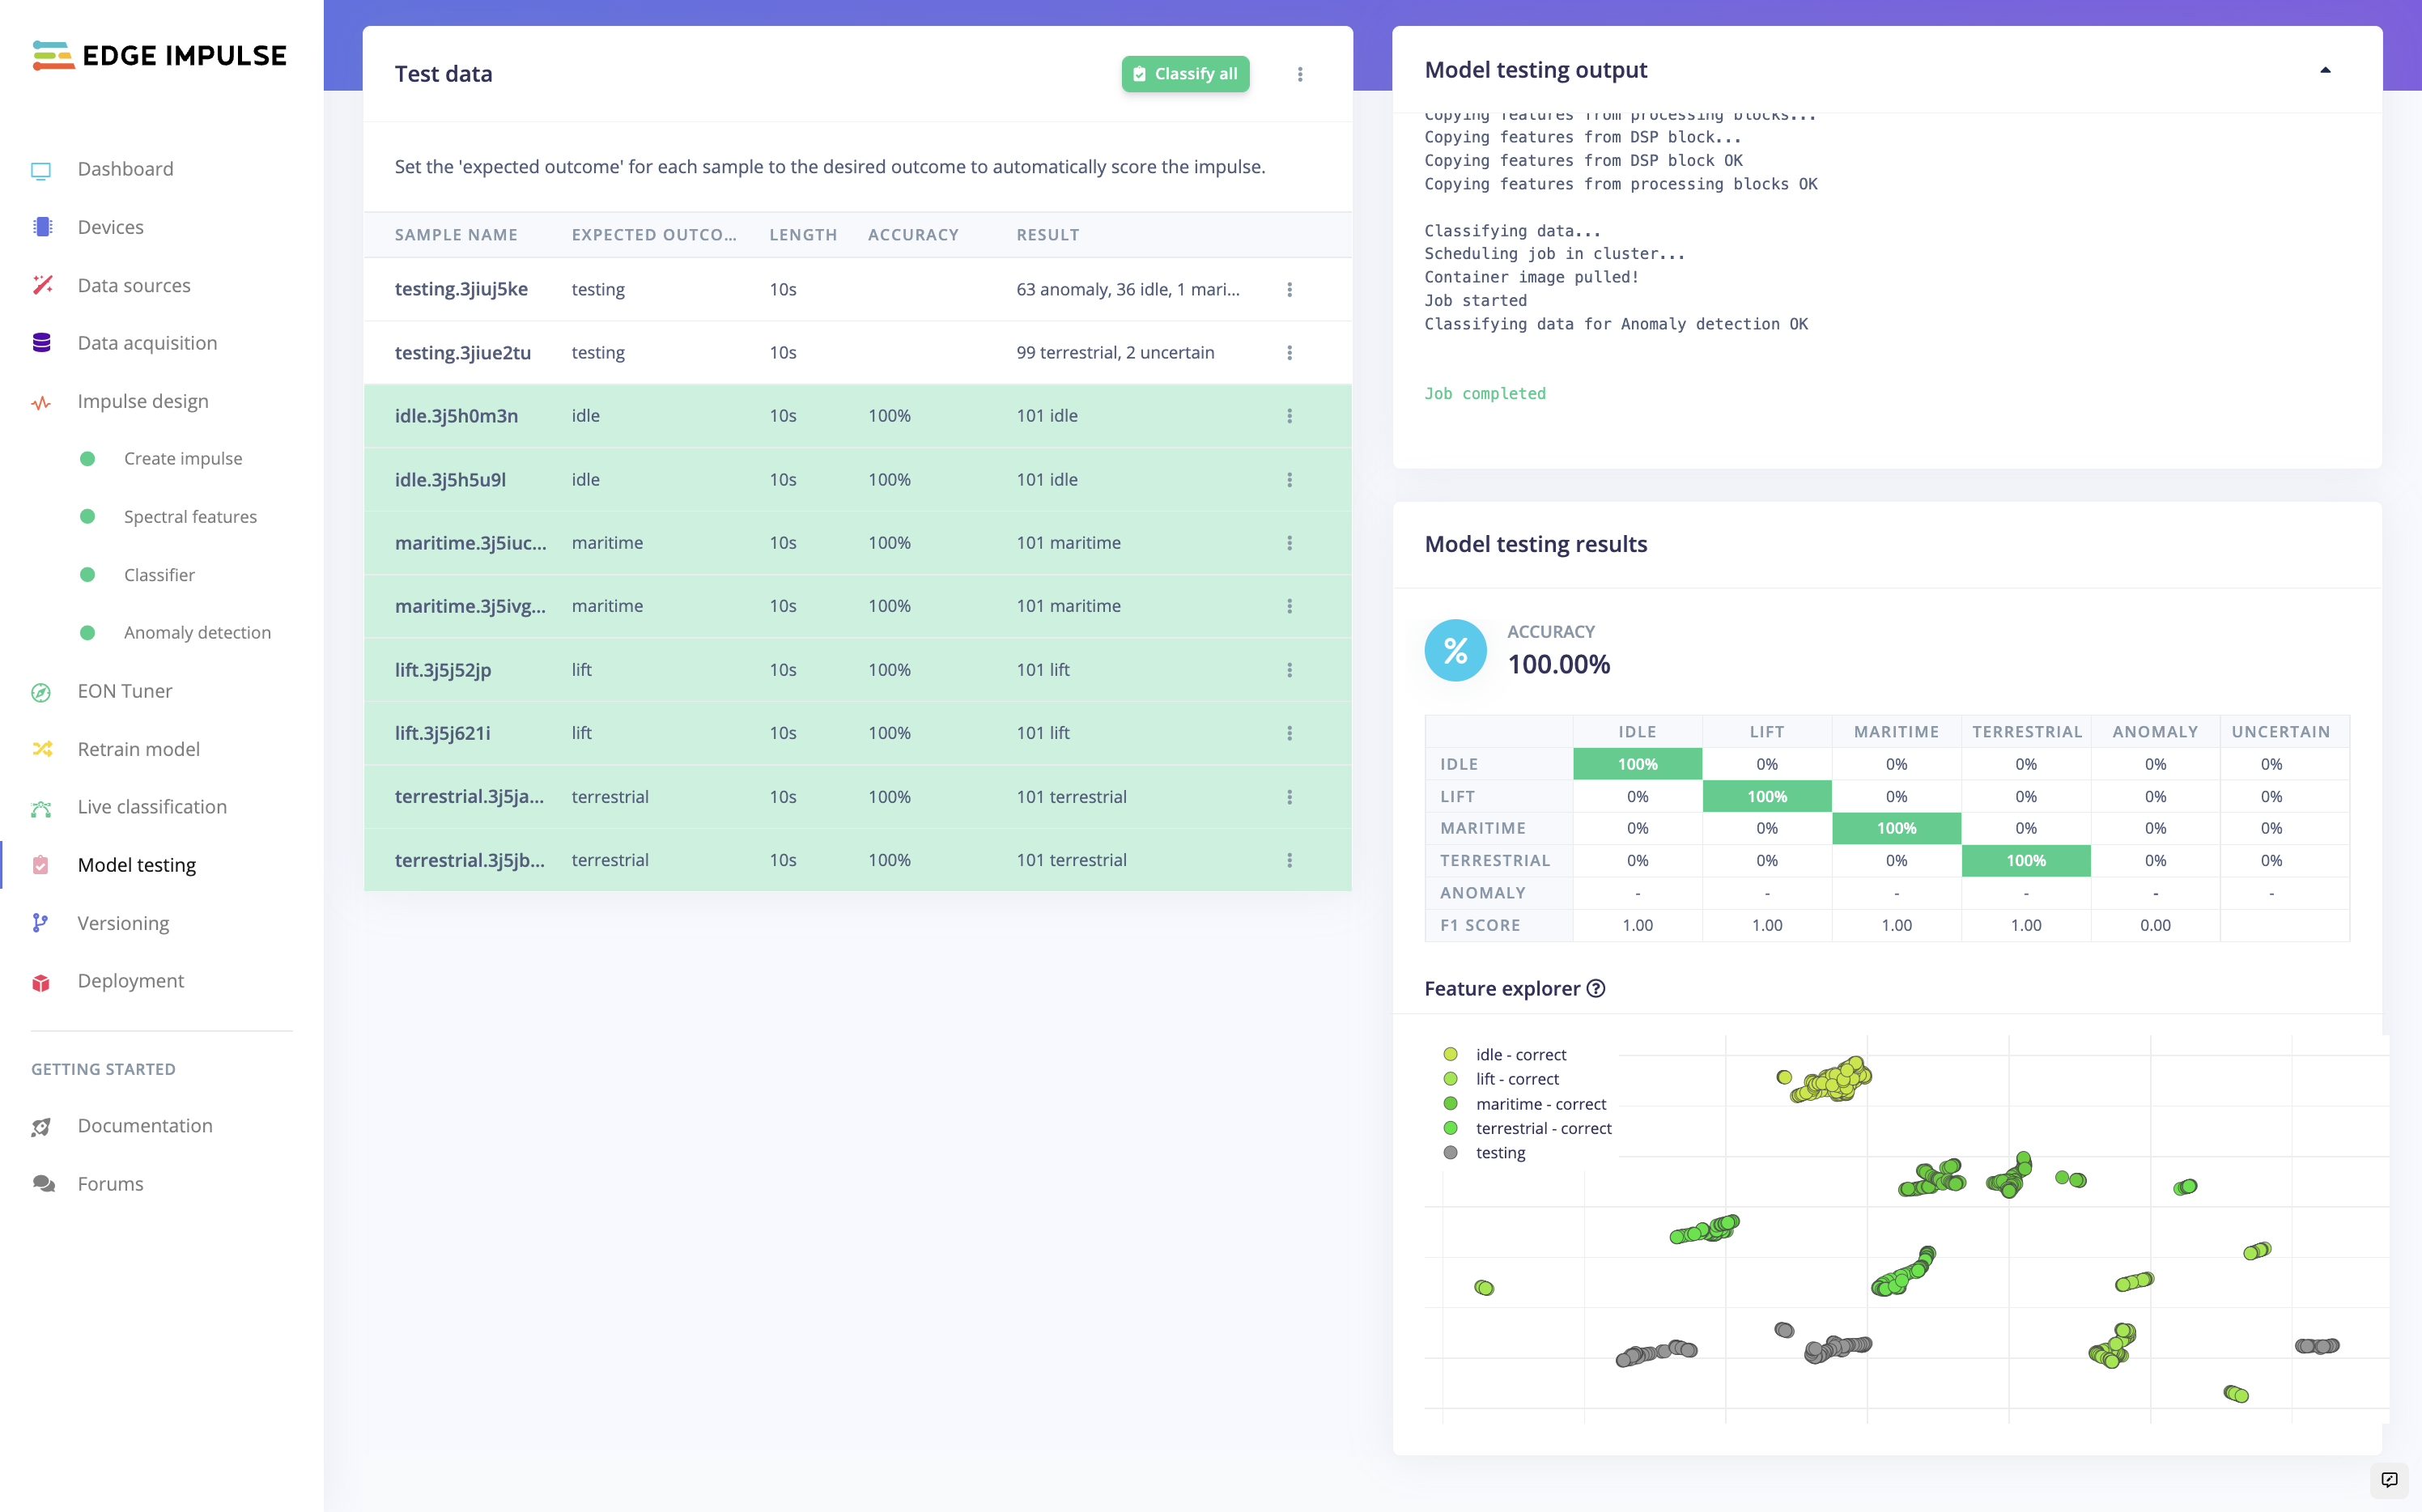
Press the **`Classify All`** button to start the model testing. The model test results will be displayed upon completion, as shown in the image below.
<!-- 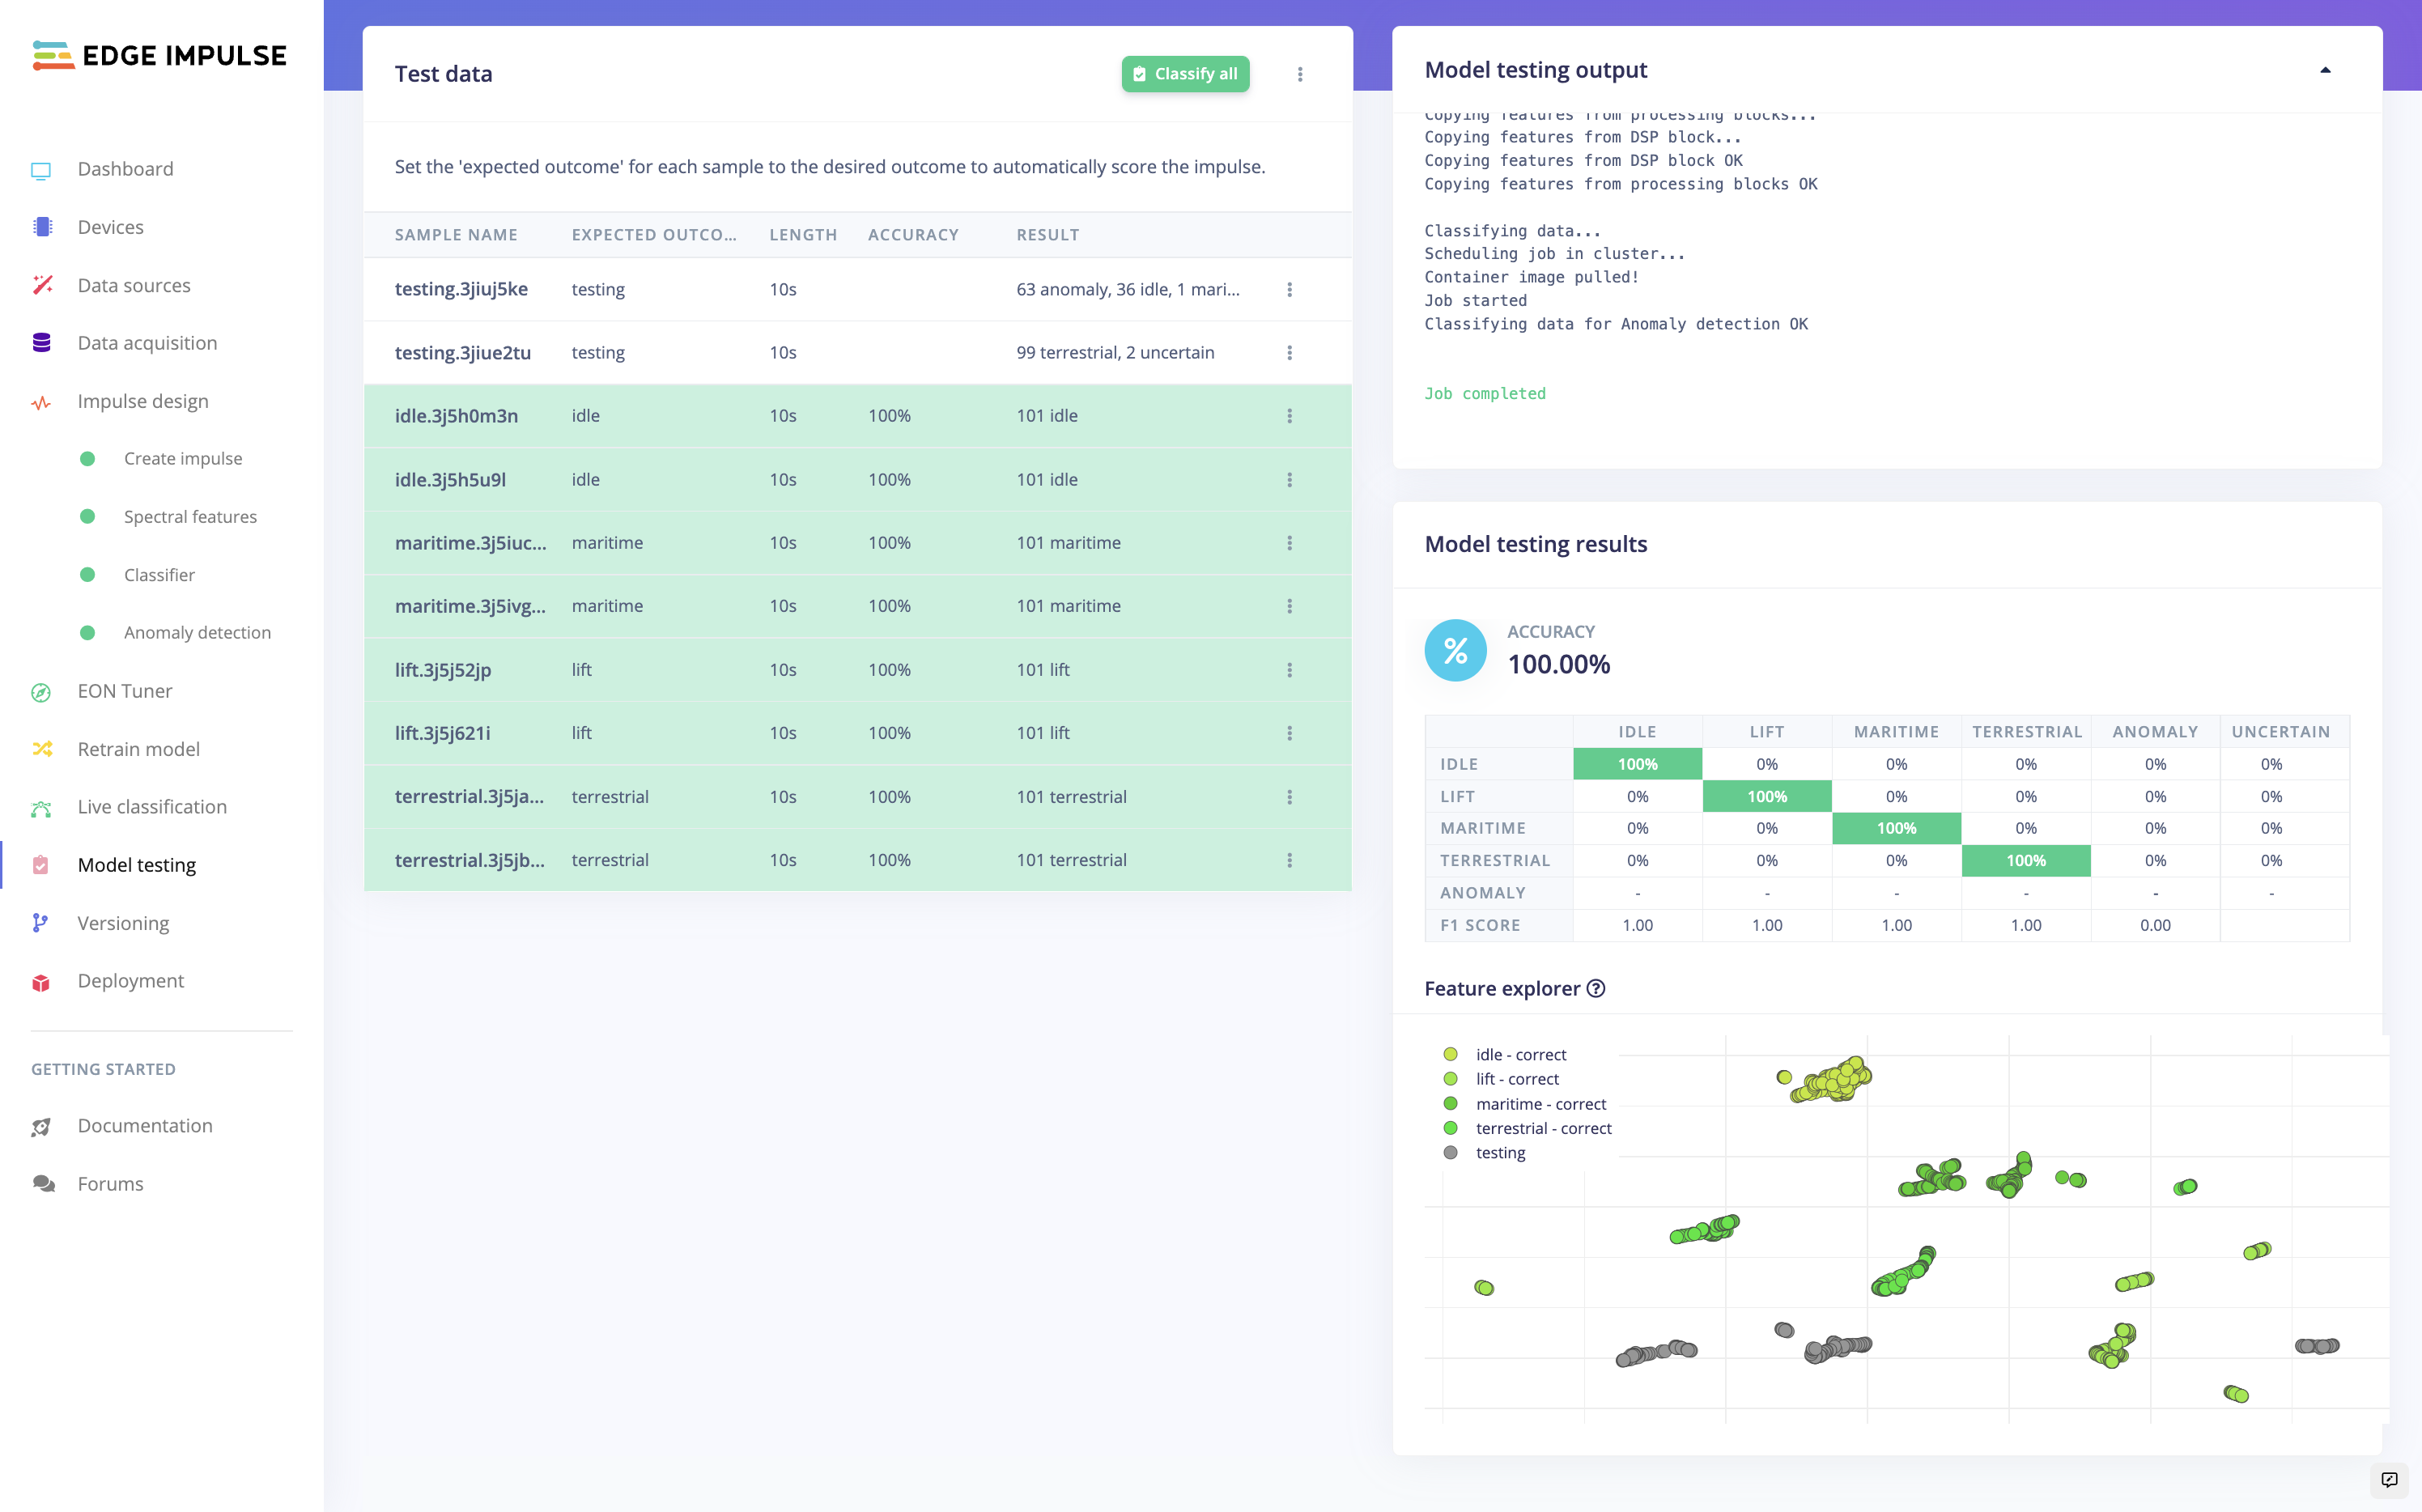 -->
### 4.2.4.9 Live Classification
Once the model is obtained, you should use the opportunity to test the Live Classification when your device is still connected to the Edge Impulse Studio. As shown in the image below, click on the **`Live Classification`** section on the left side of the Edge Impulse interface, then click the **`[Start Sampling]`** button.
<!-- 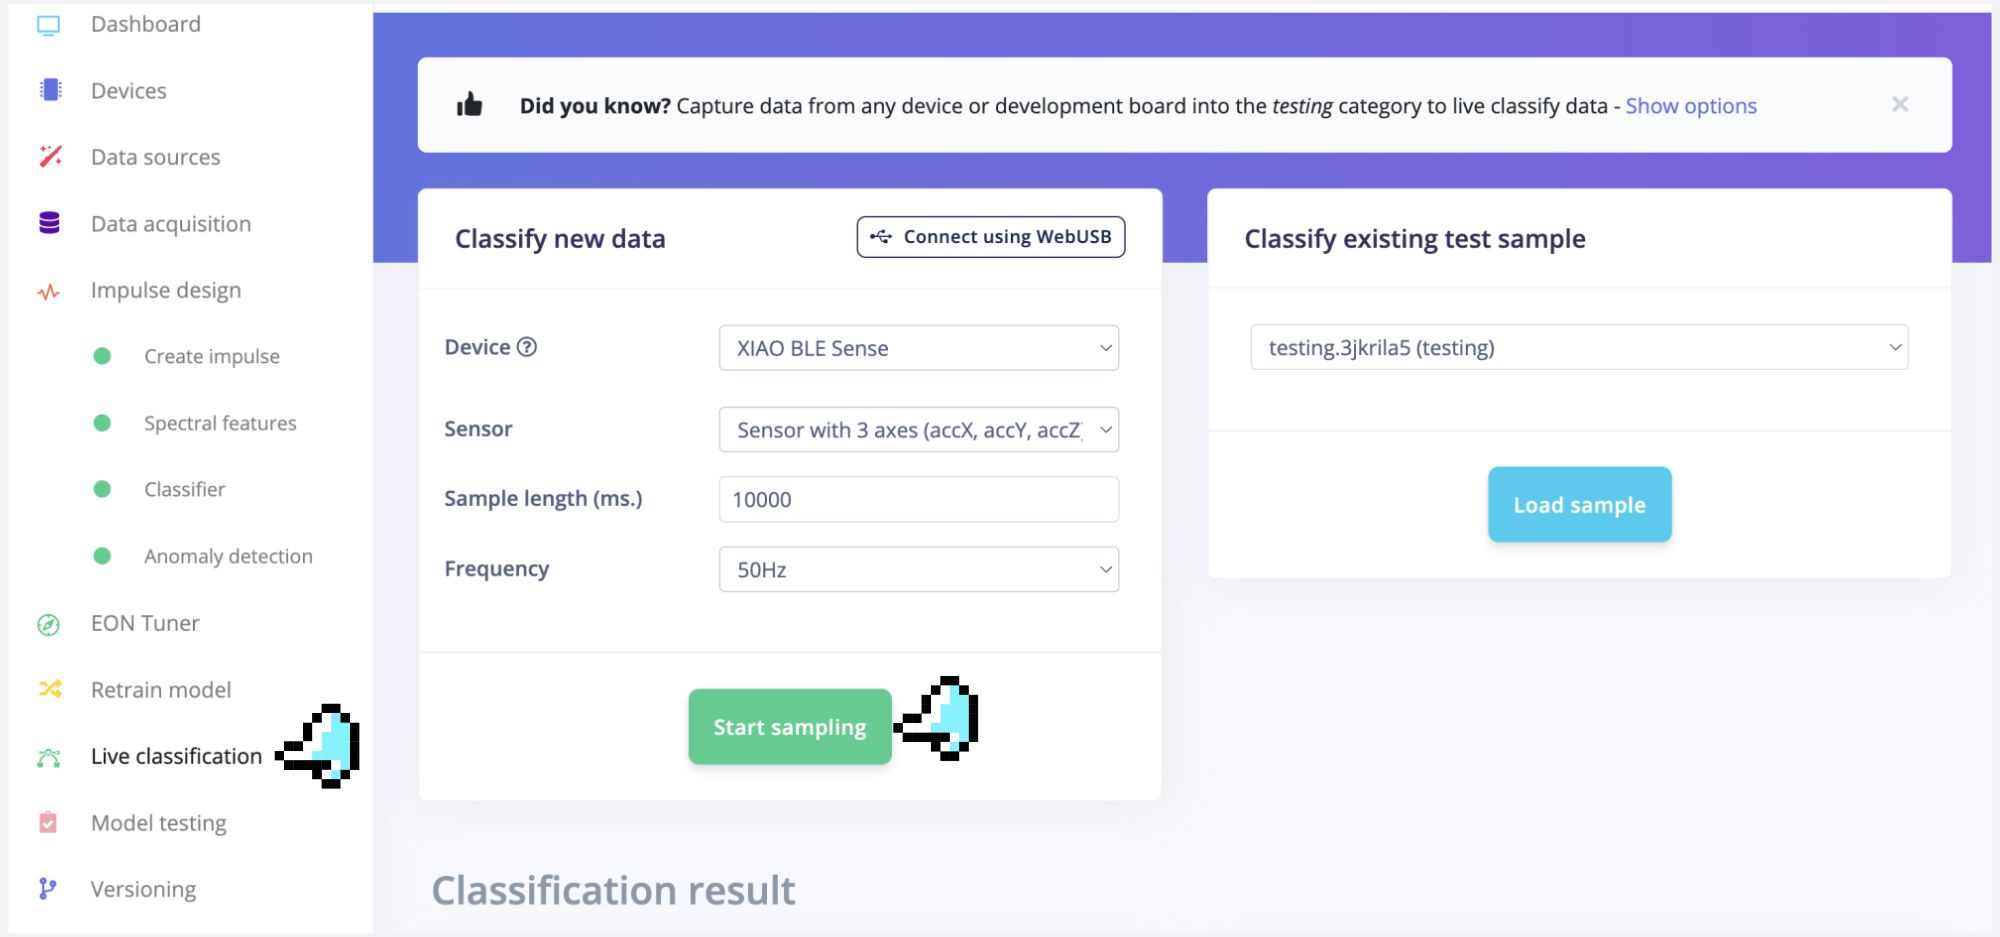 -->
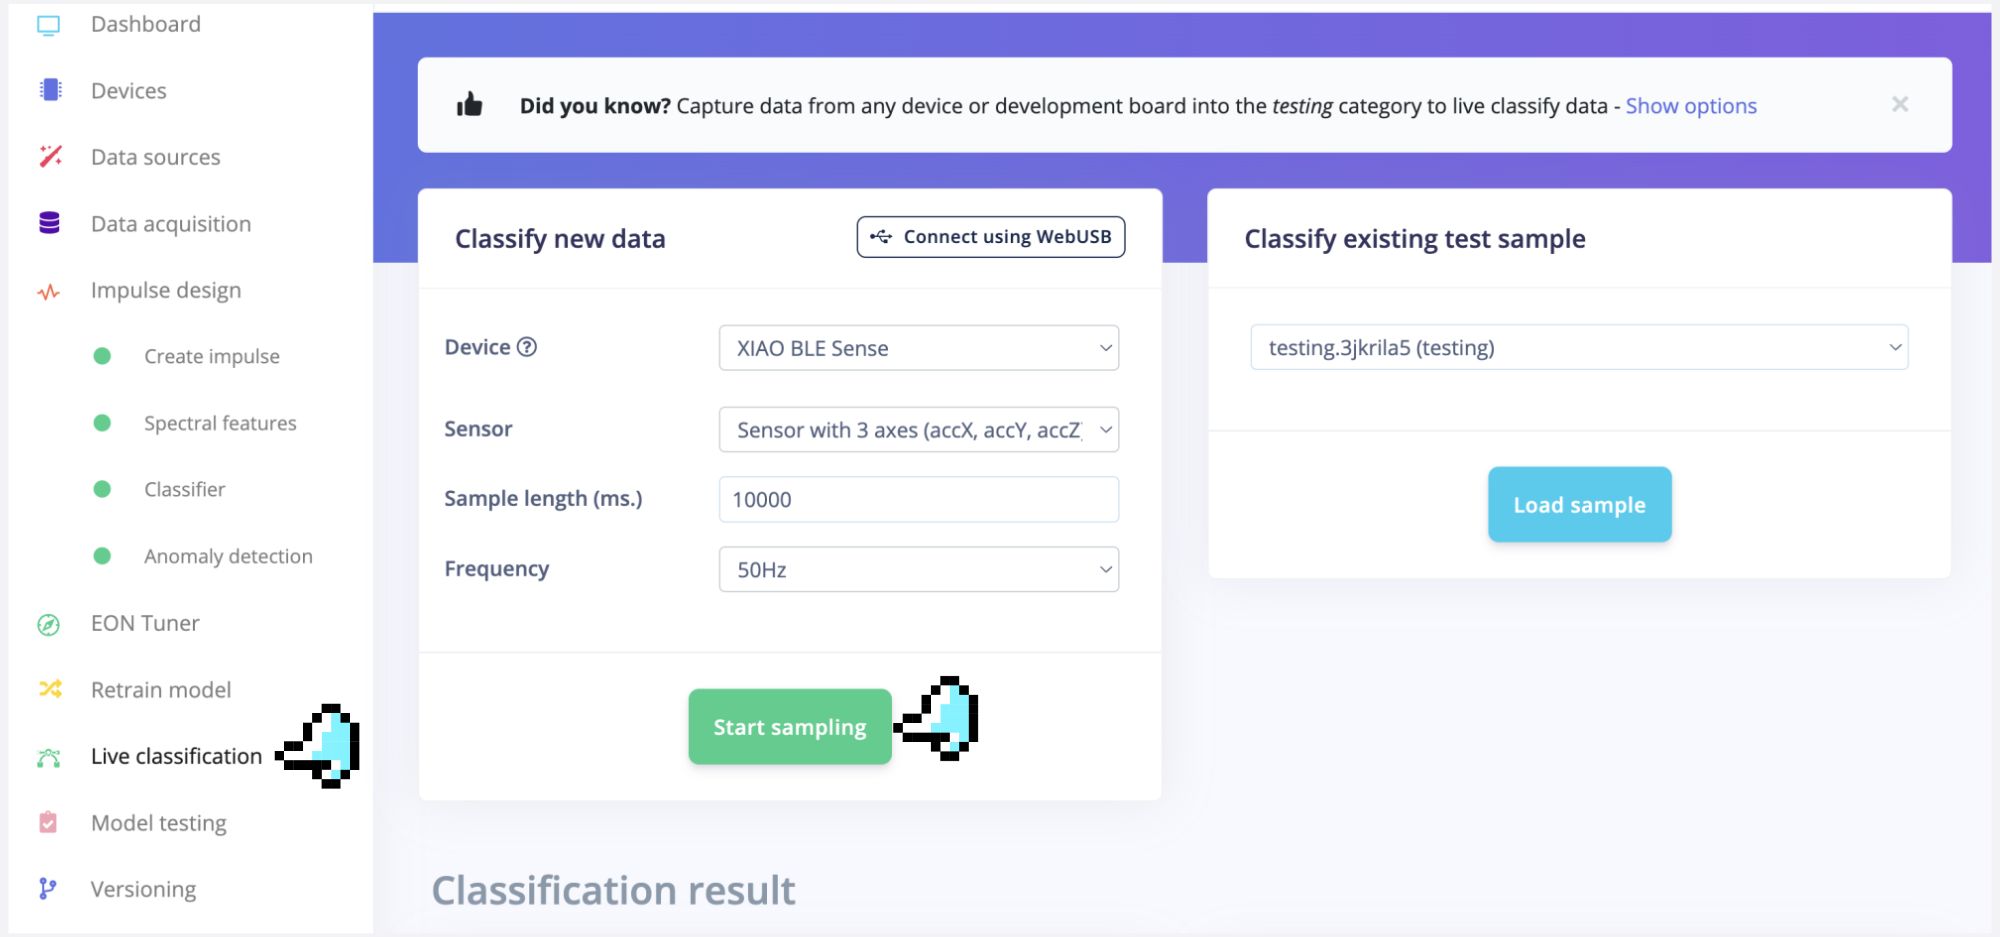
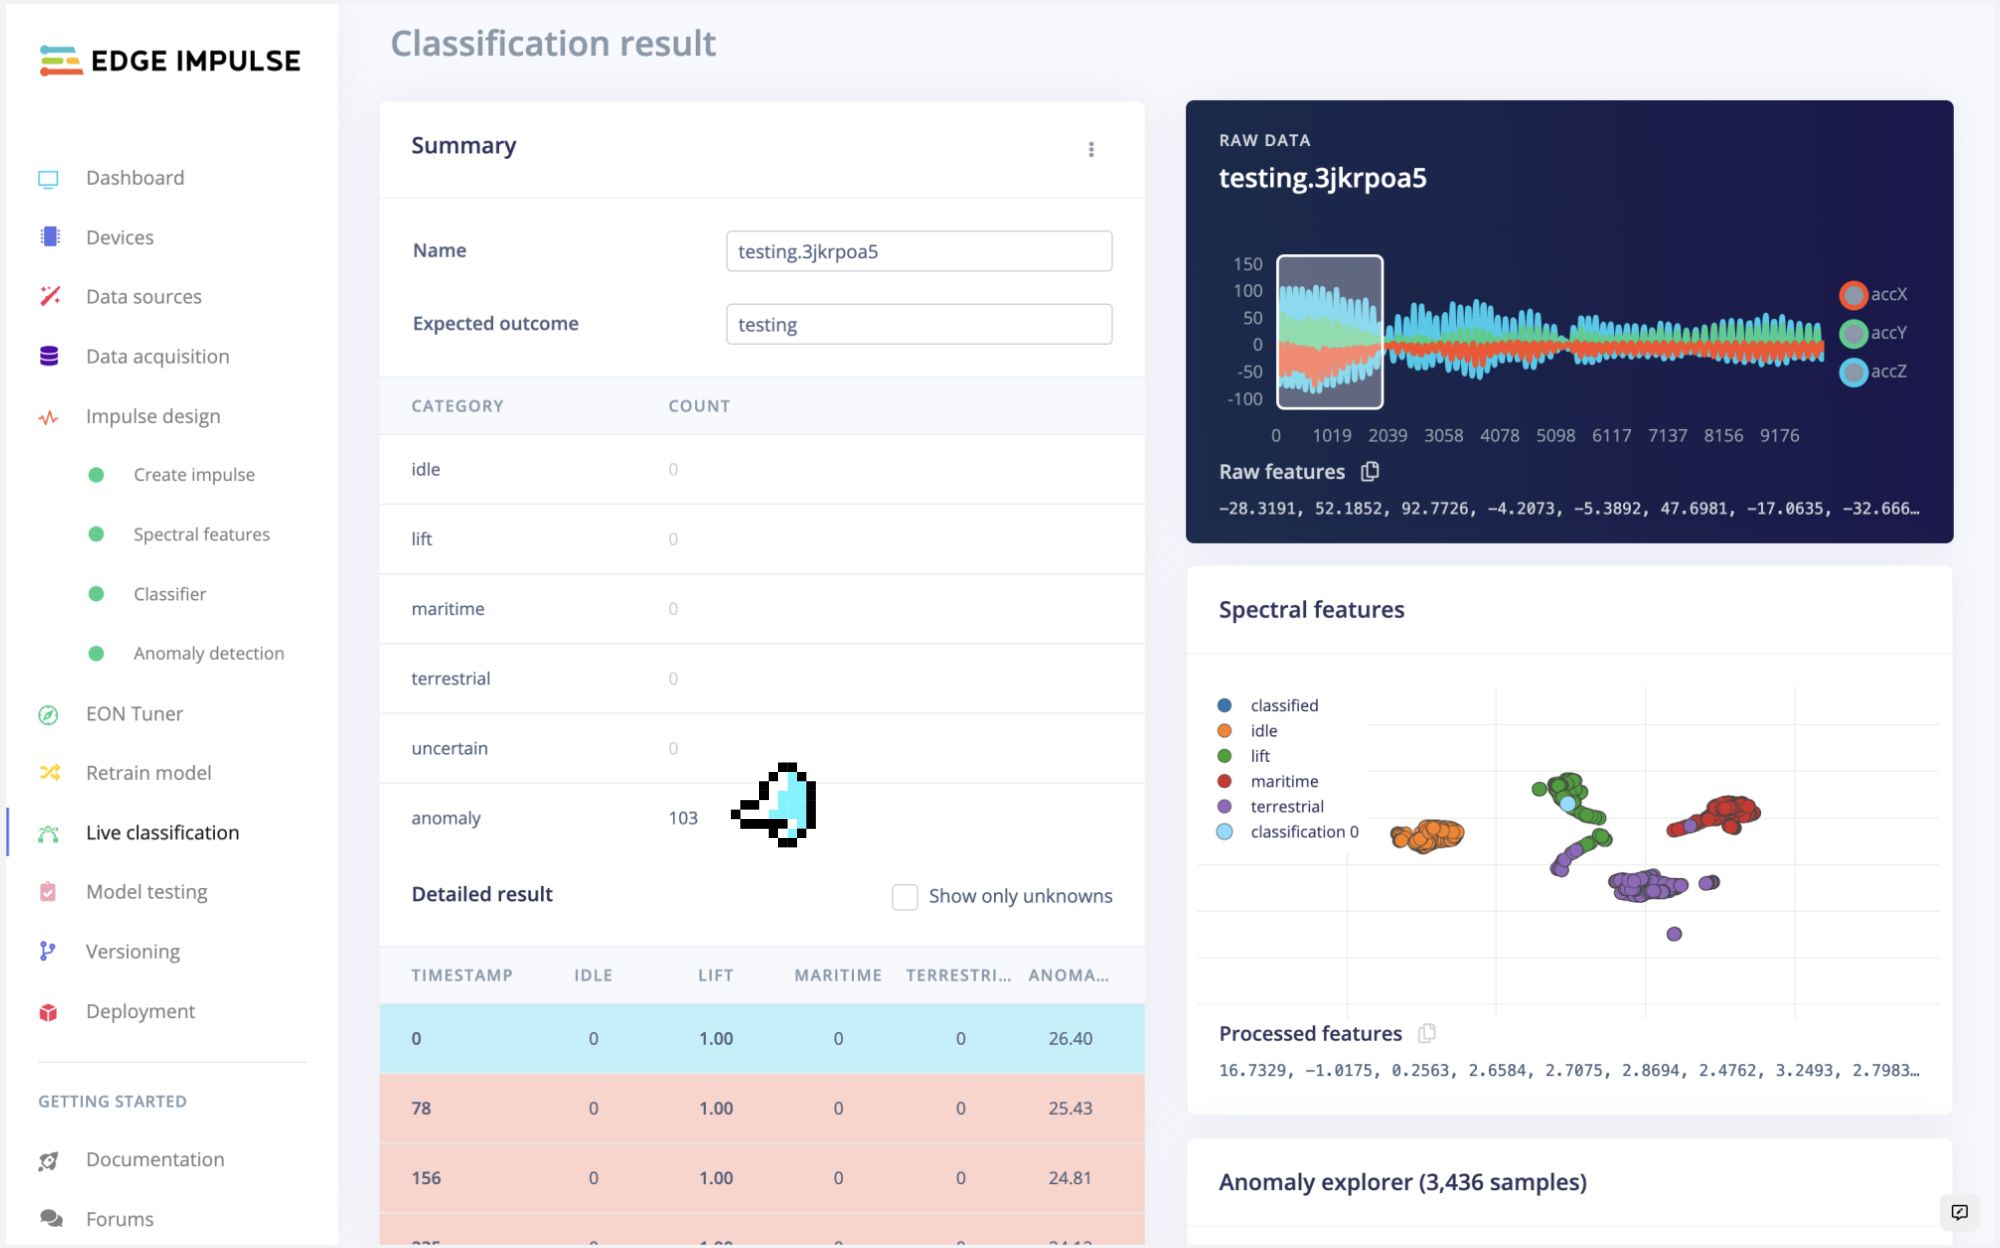
At this time, you can, for example, shake the XIAO, the process is the same as the sampling; wait a few seconds, and the classification results will be given. As shown in the image below, I shook the XIAO vigorously, and the model unhesitatingly inferred that the entire process was **anomalous**.
<!--  -->
Try now with the same movements used during data capture. The result should match the class used for training.
> ⚠️ Note: Here, you will capture real data with your device and upload it to the Edge Impulse Studio, where the trained model will be used for inference (though the model is not in your device).
### 4.2.4.10 Deployment
Now it is time for magic˜! The Studio will package all the needed libraries, preprocessing functions, and trained models, downloading them to your computer. You should select the option Arduino Library and at the bottom, select `Quantized (Int8)` and `Build`.

A Zip file will be created and downloaded to your computer.
<!-- 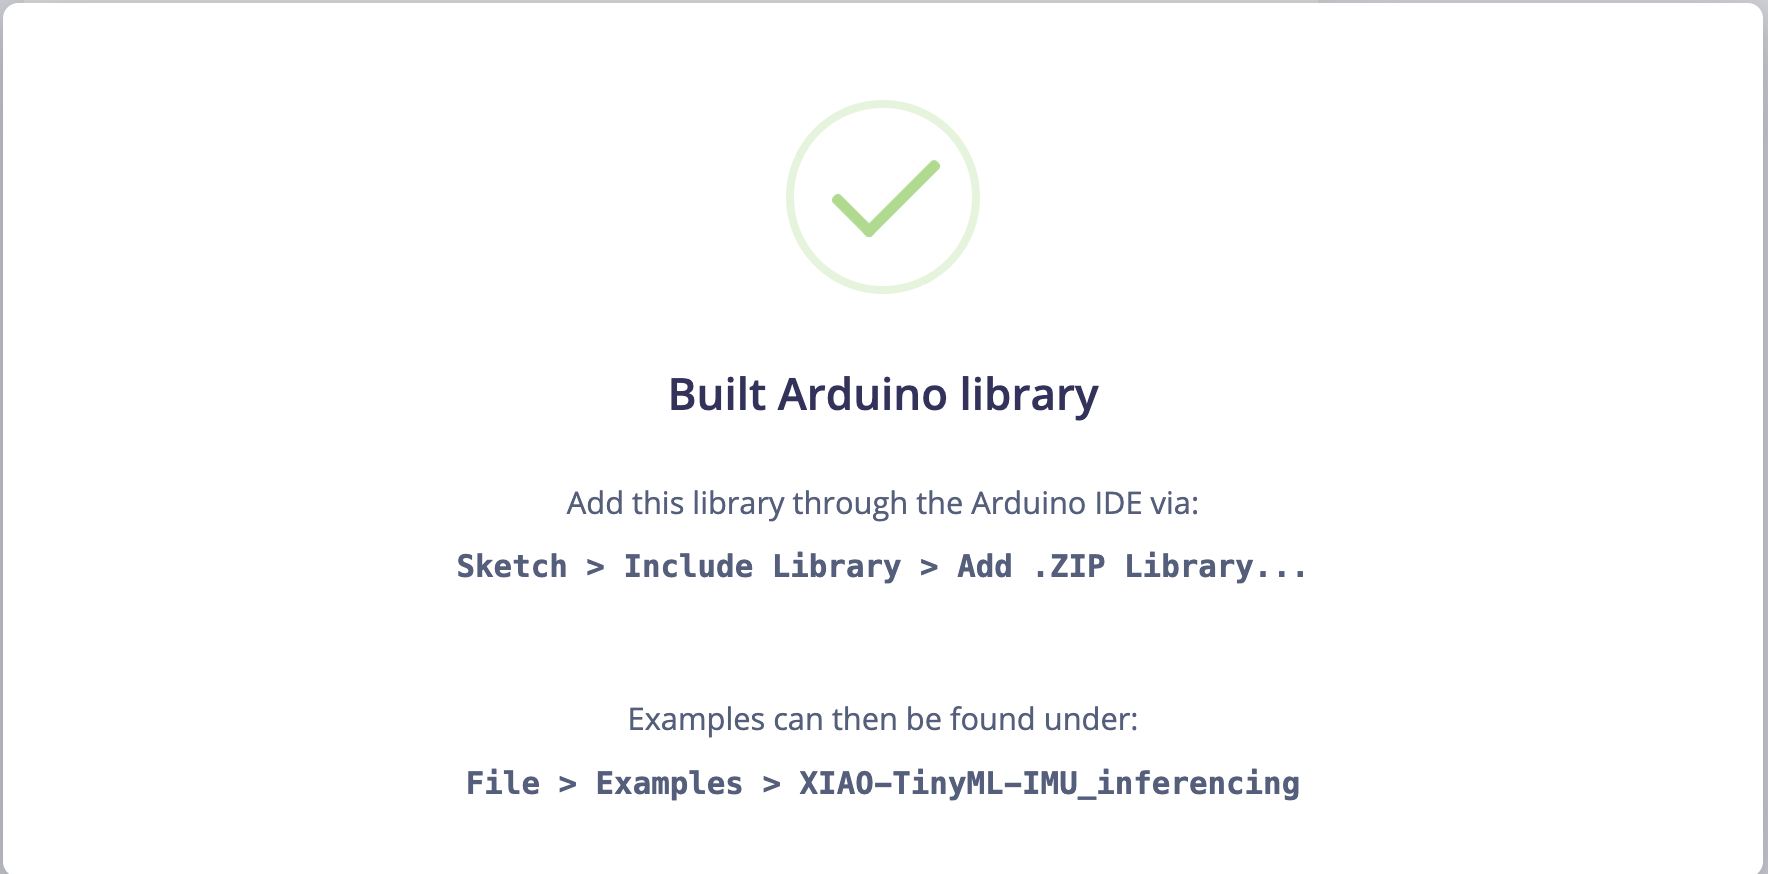 -->
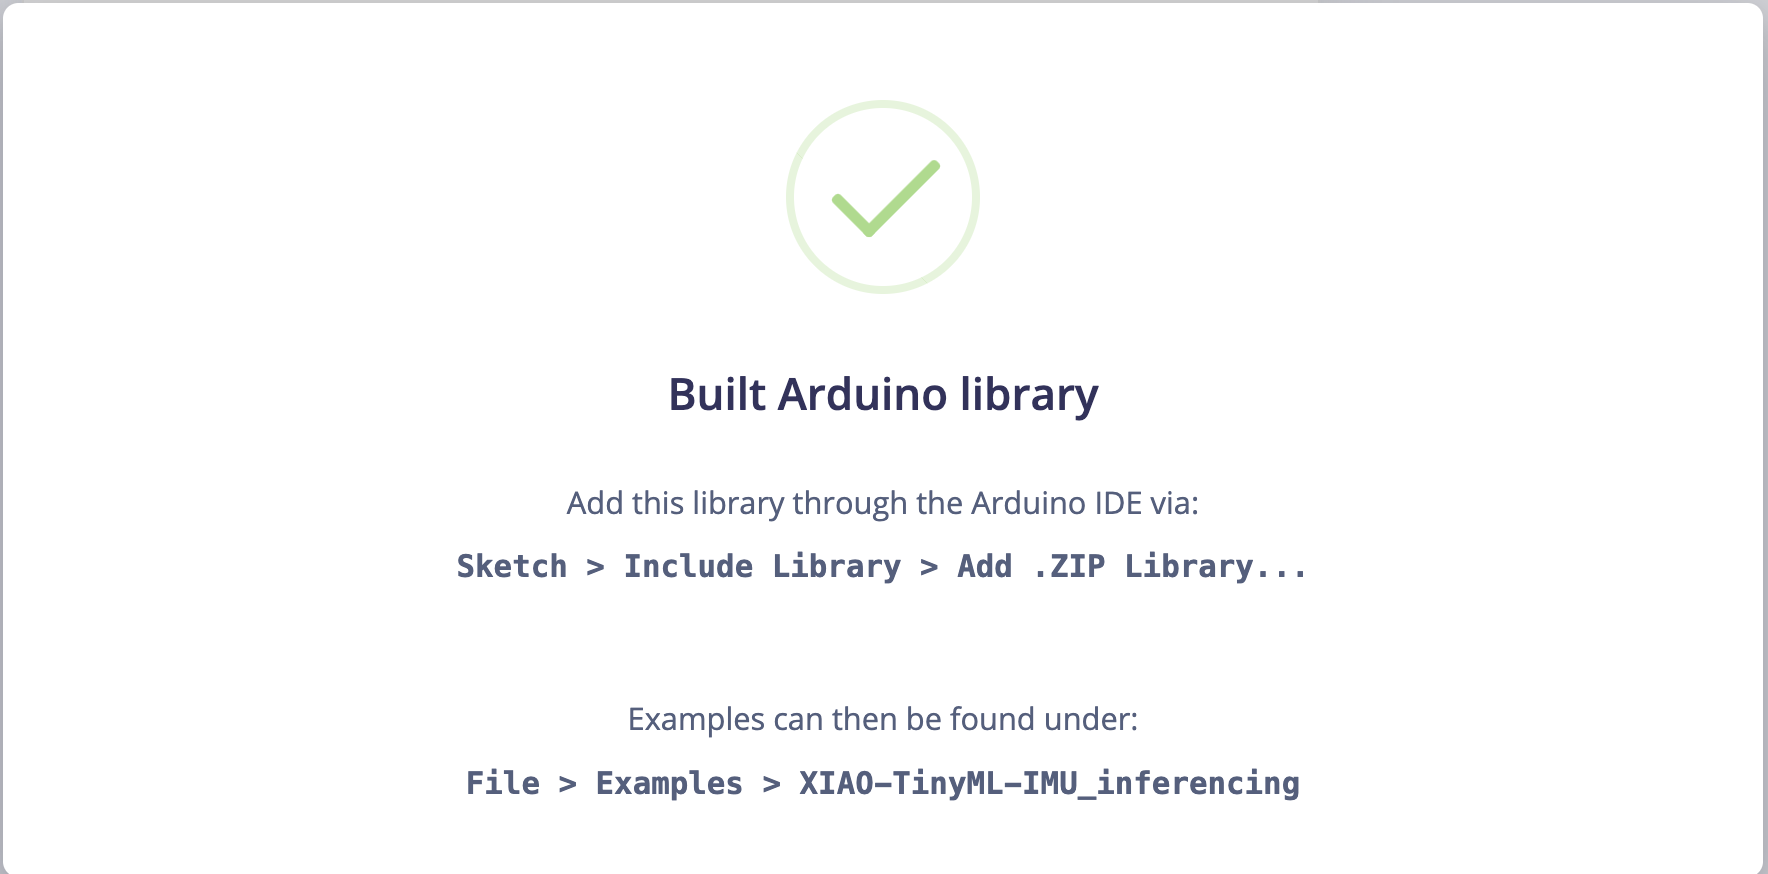
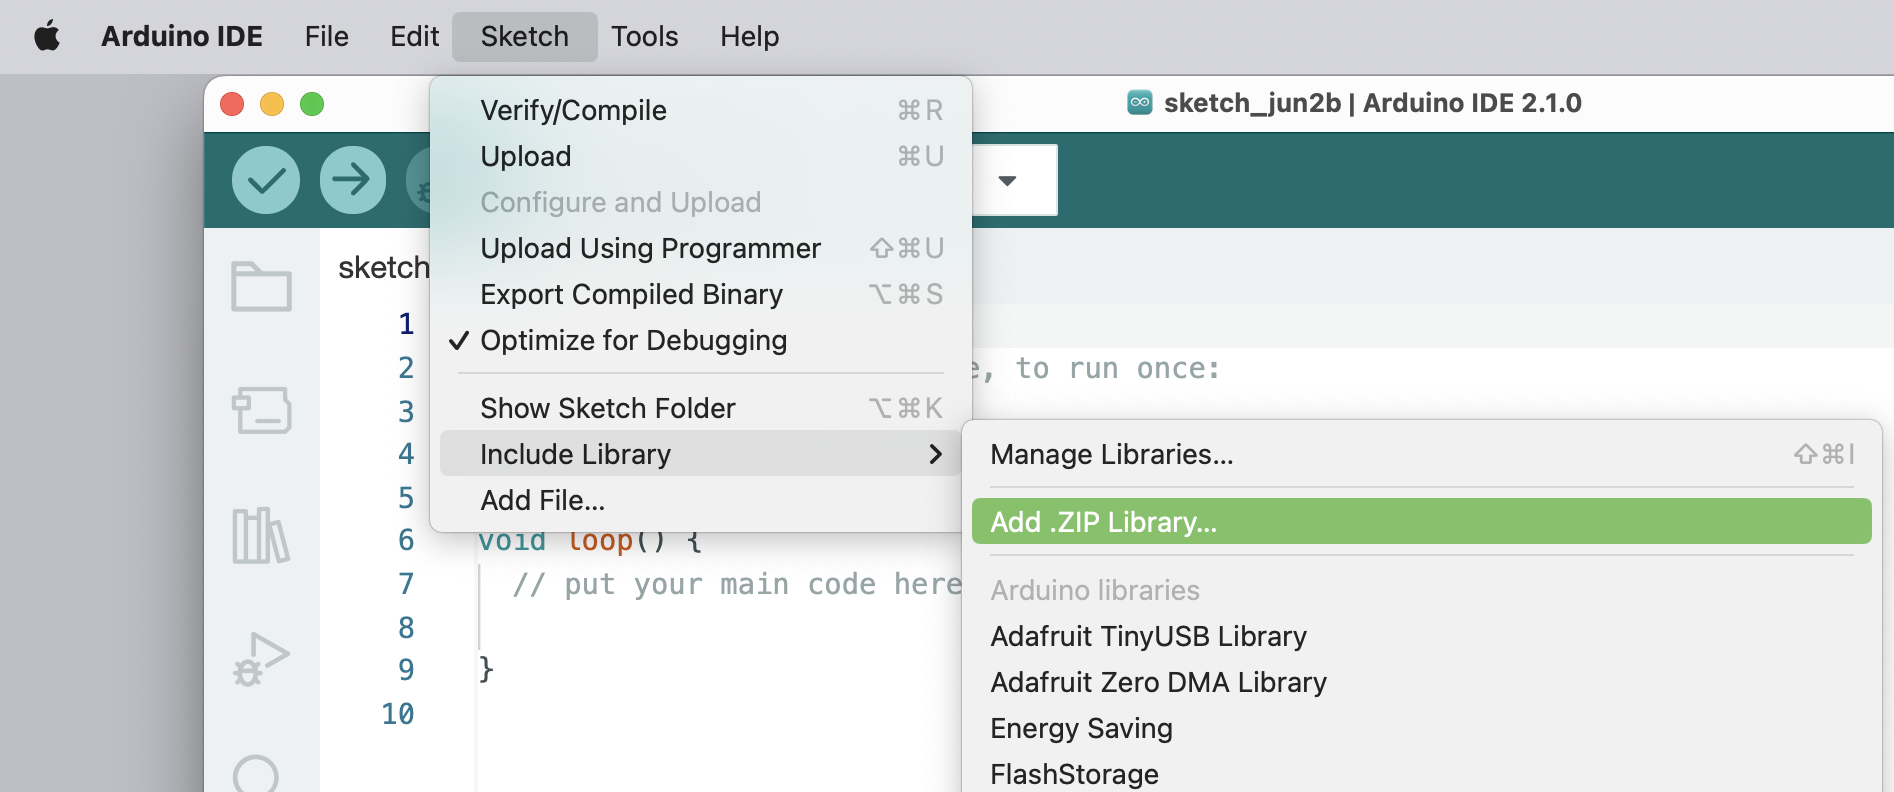
On your Arduino IDE, go to `Sketch` tab and select the option `Add .ZIP Library`.
<!--  -->
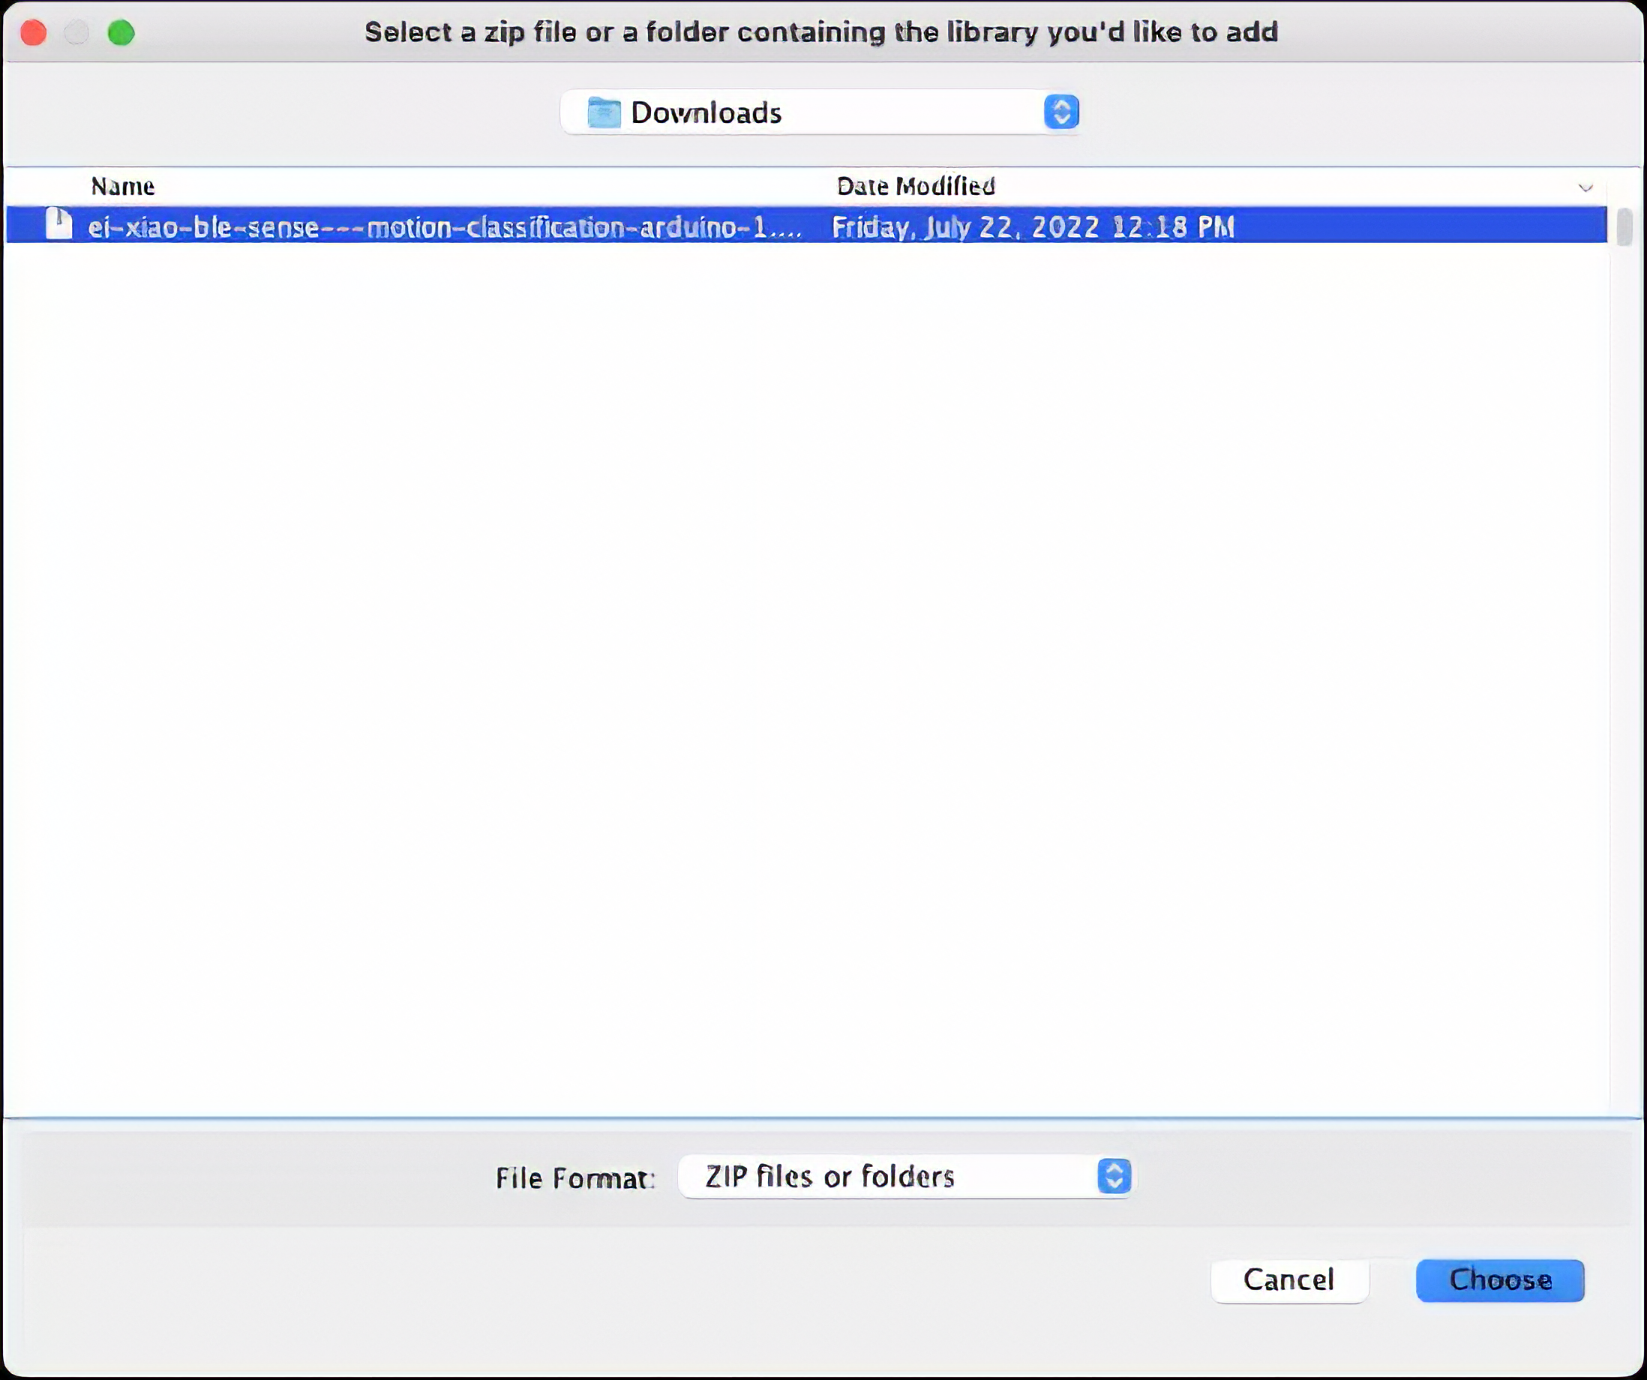
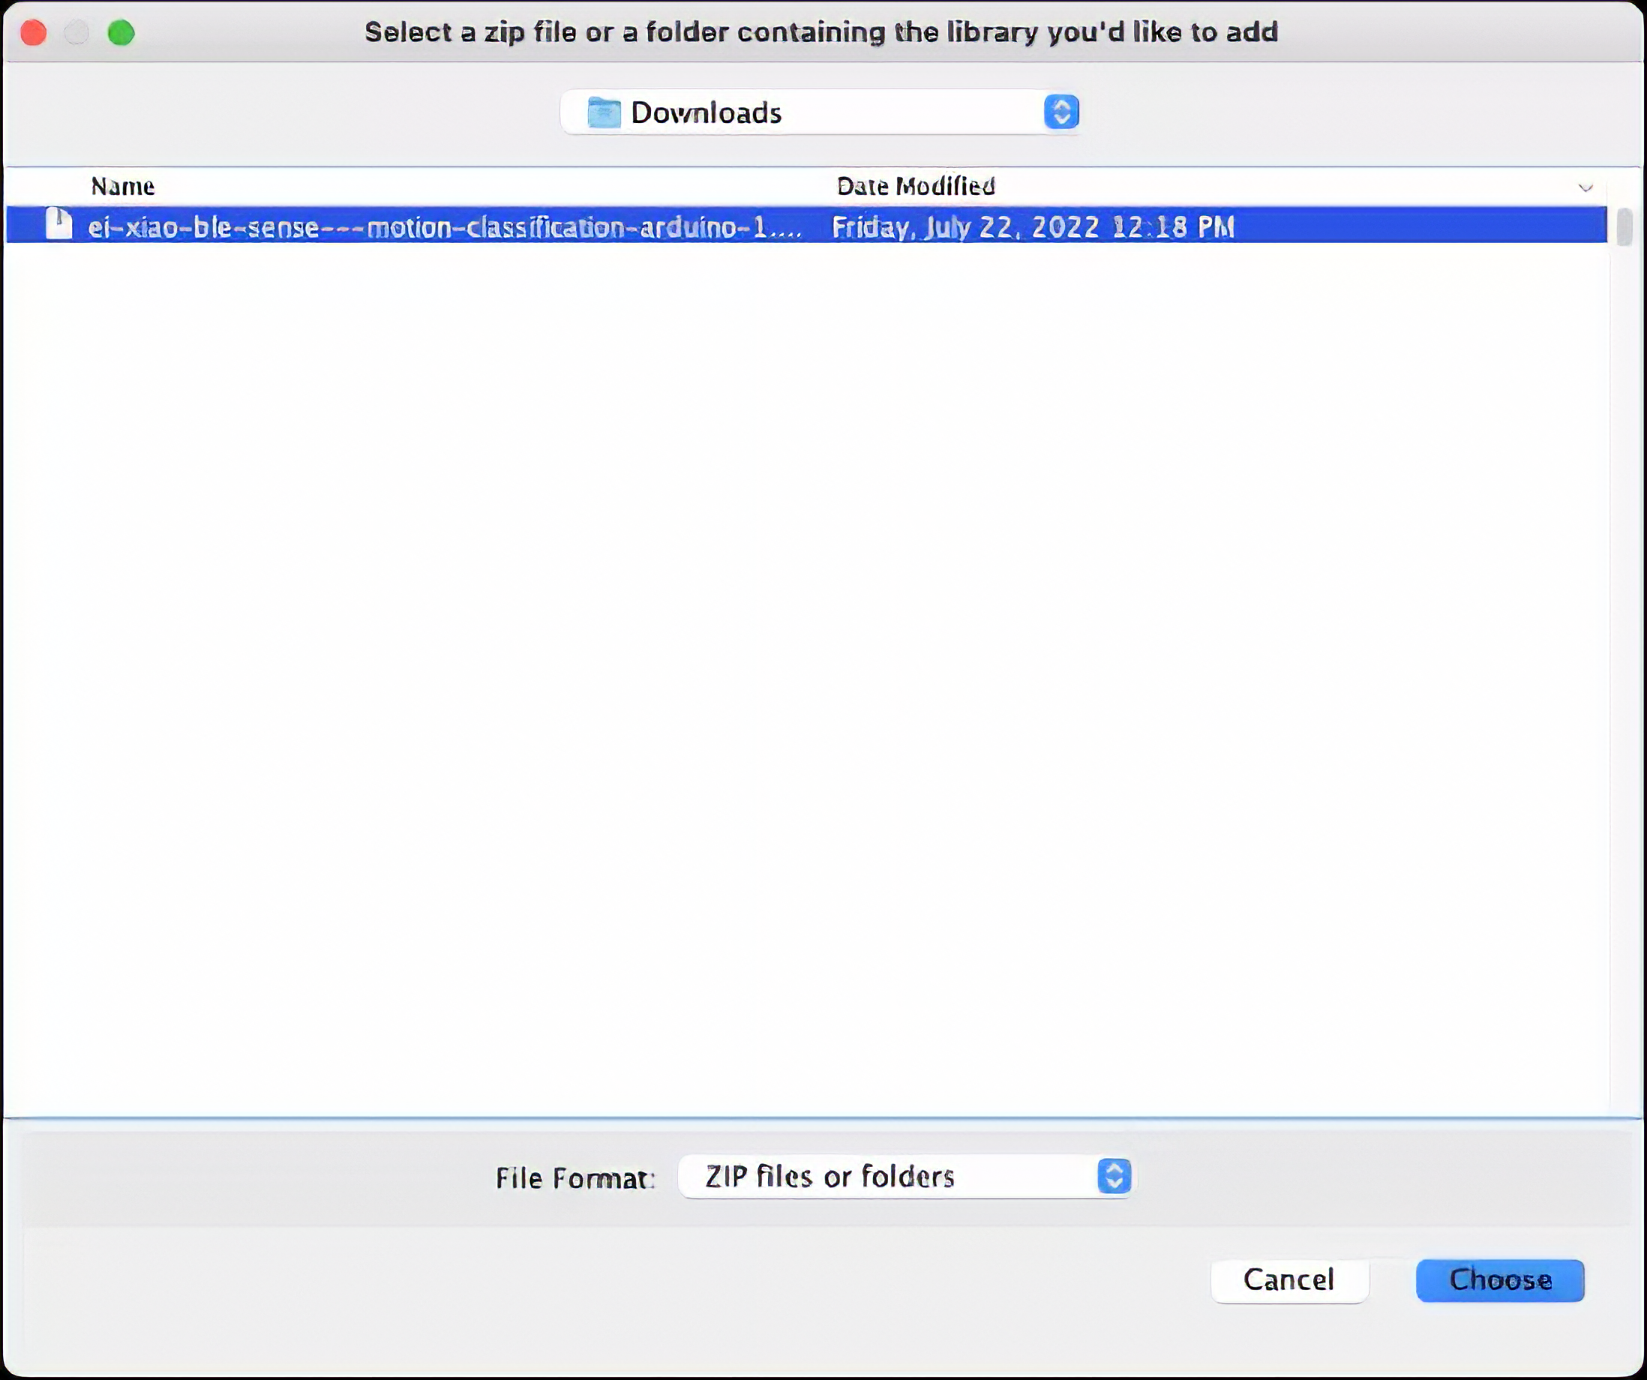
and Choose the.zip file downloaded by the Studio:
<!--  -->
### 4.2.4.11 Inference
Now, it is time for a real test. We will make inferences wholly disconnected from the Studio. Let's change one of the code examples created when you deploy the Arduino Library.
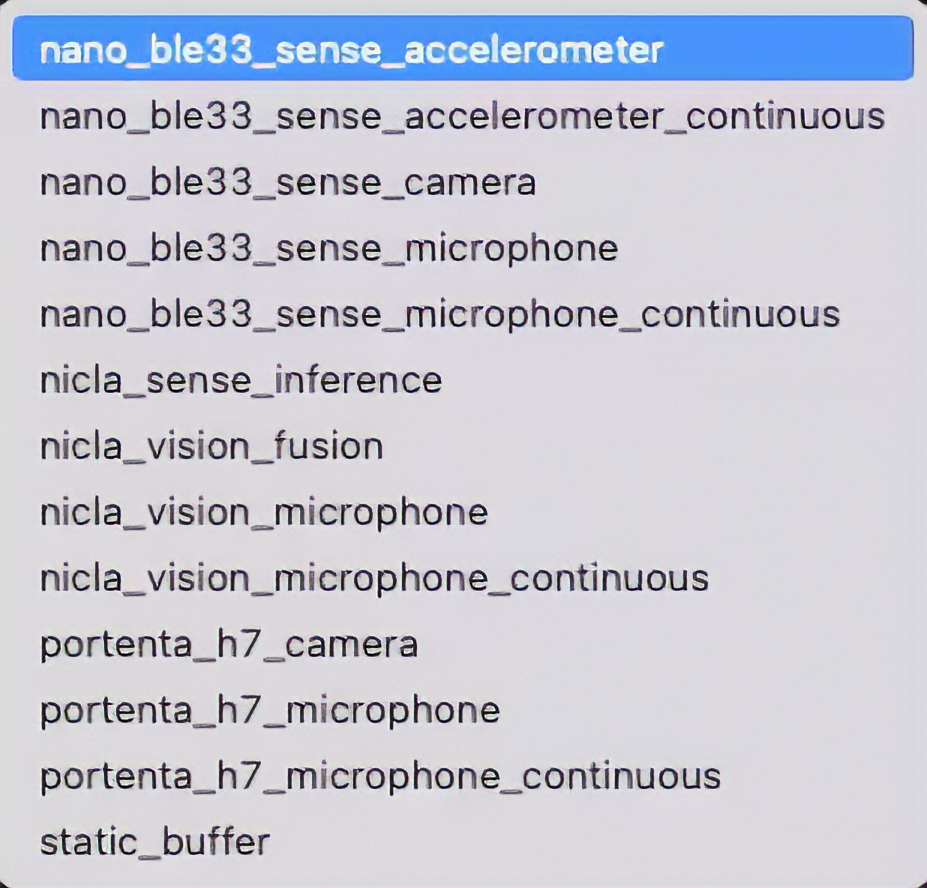
In your Arduino IDE, go to `File/Examples` tab and look for your project, and on examples, select `nano_ble_sense_accelerometer`:
<!--  -->
<img src="https://files.seeedstudio.com/wiki/XIAO_Big_Power-Board-ebook-photo/chapter_4-2/chapter_4-2_44.png" width="400" height="auto" />
Of course, the Arduino Nano BLE 33 differs from your board, the XIAO, but we can have the code working with only a few changes. For example, at the beginning of the code, you have the library related to Arduino Sense IMU:
``` cpp
/* Includes -------------------------------------------------------------- */
#include <XIAO_BLE_Sense_-_Motion_Classification_inferencing.h>
#include <Arduino_LSM9DS1.h>
```
Change the "includes" portion with the code related to the XIAO nRF52840 Sense IMU:
``` cpp
/* Includes -------------------------------------------------------------- */
#include <XIAO_BLE_Sense_-_Motion_Classification_inferencing.h>
#include "LSM6DS3.h"
#include "Wire.h"
//Create an instance of class LSM6DS3
LSM6DS3 xIMU(I2C_MODE, 0x6A); //I2C device address 0x6A
```
On the setup function, initiate the IMU using the name that you stated before:
``` cpp
if (xIMU.begin() != 0) {
ei_printf("Failed to initialize IMU!\r\n");
}
else {
ei_printf("IMU initialized\r\n");
}
```
At the loop function, the buffers: `buffer[ix], buffer[ix + 1]` and `buffer[ix + 2]` will receive the 3 axis data captured by the accelerometer. On the original code, you have the line:
``` cpp
IMU.readAcceleration(buffer[ix], buffer[ix + 1], buffer[ix + 2]);
```
Change it with this block of code:
``` cpp
buffer[ix] = xIMU.readFloatAccelX();
buffer[ix + 1] = xIMU.readFloatAccelY();
buffer[ix + 2] = xIMU.readFloatAccelZ();
```
<!--  -->
> Get this code online 🔗 <br />
> <https://github.com/Mjrovai/Seeed-XIAO-BLE-Sense/blob/main/XIAO_BLE_Sense_accelerometer/XIAO_BLE_Sense_accelerometer.ino>
And that is it! You can now upload the code to your device and proceed with the inferences.
You can see the result of the inference of each class on the images:


### Post-processing
Now that we know the model is working since it detects the movements, we suggest that you modify the code to see the result with the XIAO completely offline (disconnected from the PC and powered by a battery, a power bank, or an independent 5V power supply).
The idea is that if one specific movement is detected, a particular LED could be lit. For example, if *terrestrial* is detected, the Green LED will light; if *maritime*, the Red LED will light, if it is a *lift,* the Blue LED will light; and if no movement is detected *(idle*), the LEDs will be OFF. You can also add a condition when an anomaly is detected, in this case, for example, a white color can be used (all e LEDs light simultaneously).
### 4.2.4.12 Conclusion
The Seeed Studio XIAO nRF52840 Sense is a giant tiny device! It is powerful, trustworthy, not expensive, low power, and has suitable sensors to be used on the most common embedded machine learning applications. Even though Edge Impulse does not officially support XIAO nRF52840 Sense, we also realized that it could be easily connected with the Studio.
> On the GitHub repository, you will find the last version of the codes: [Seeed-XIAO-BLE-Sense](https://github.com/Mjrovai/Seeed-XIAO-BLE-Sense).
The applications for motion classification and anomaly detection are extensive, and the XIAO is well-suited for scenarios where low power consumption and edge processing are advantageous. Its small form factor and efficiency in processing make it an ideal choice for deploying portable and remote applications where real-time processing is crucial and connectivity may be limited.
### 4.2.4.13 Case Applications
Before we finish, consider that Movement Classification and Object Detection can be utilized in many applications across various domains. Here are some of the potential applications:
#### **Industrial and Manufacturing**
- **Predictive Maintenance**: Detecting anomalies in machinery motion to predict failures before they occur.
- **Quality Control**: Monitoring the motion of assembly lines or robotic arms for precision assessment and deviation detection from the standard motion pattern.
- **Warehouse Logistics**: Managing and tracking the movement of goods with automated systems that classify different types of motion and detect anomalies in handling.
#### **Healthcare**
- **Patient Monitoring**: Detecting falls or abnormal movements in the elderly or those with mobility issues.
- **Rehabilitation**: Monitoring the progress of patients recovering from injuries by classifying motion patterns during physical therapy sessions.
- **Activity Recognition**: Classifying types of physical activity for fitness applications or patient monitoring.
#### **Consumer Electronics**
- **Gesture Control**: Interpreting specific motions to control devices, such as turning on lights with a hand wave.
- **Gaming**: Enhancing gaming experiences with motion-controlled inputs.
#### **Transportation and Logistics**
- **Vehicle Telematics**: Monitoring vehicle motion for unusual behavior such as hard braking, sharp turns, or accidents.
- **Cargo Monitoring**: Ensuring the integrity of goods during transport by detecting unusual movements that could indicate tampering or mishandling.
#### **Smart Cities and Infrastructure**
- **Structural Health Monitoring**: Detecting vibrations or movements within structures that could indicate potential failures or maintenance needs.
- **Traffic Management**: Analyzing the flow of pedestrians or vehicles to improve urban mobility and safety.
#### **Security and Surveillance**
- **Intruder Detection**: Detecting motion patterns typical of unauthorized access or other security breaches.
- **Wildlife Monitoring**: Detecting poachers or abnormal animal movements in protected areas.
#### **Agriculture**
- **Equipment Monitoring**: Tracking the performance and usage of agricultural machinery.
- **Animal Behavior Analysis**: Monitoring livestock movements to detect behaviors indicating health issues or stress.
#### **Environmental Monitoring**
- **Seismic Activity**: Detecting irregular motion patterns that precede earthquakes or other geologically relevant events.
- **Oceanography**: Studying wave patterns or marine movements for research and safety purposes.