Visualizing world coordinate pose map #39
Comments
|
times.txt is the absolute timestamp. So to get the time between frames, you need to compute the differences. Other than that, you can watch this code here that compute the 5-pose snippet. If you want to do the inverse operation, that is, compute the pose back to being relative to the first frame of the whole sequence and not only the 5 frame snippet, it's unfortunately going to be complicated. You have overlapping poses snippets with different scales for example : so if you want to get the sixth pose relative to the pose 0, you can compute it in lots of different ways : you can do 0 -> 4 with first snippet and 4 -> 6 with second, or you can use the three snippets. An important point to note is that pose where not trained to be consistent with each other. that is, the translation scale might change, because the corresponding depth did also change : the only thing that was trained in an absolute matter is the resulting optical flow of both pose and depth. As a consequence you will most likely endu up with having to rescale the translation of evry 5-frame snippet with ground truth. |
|
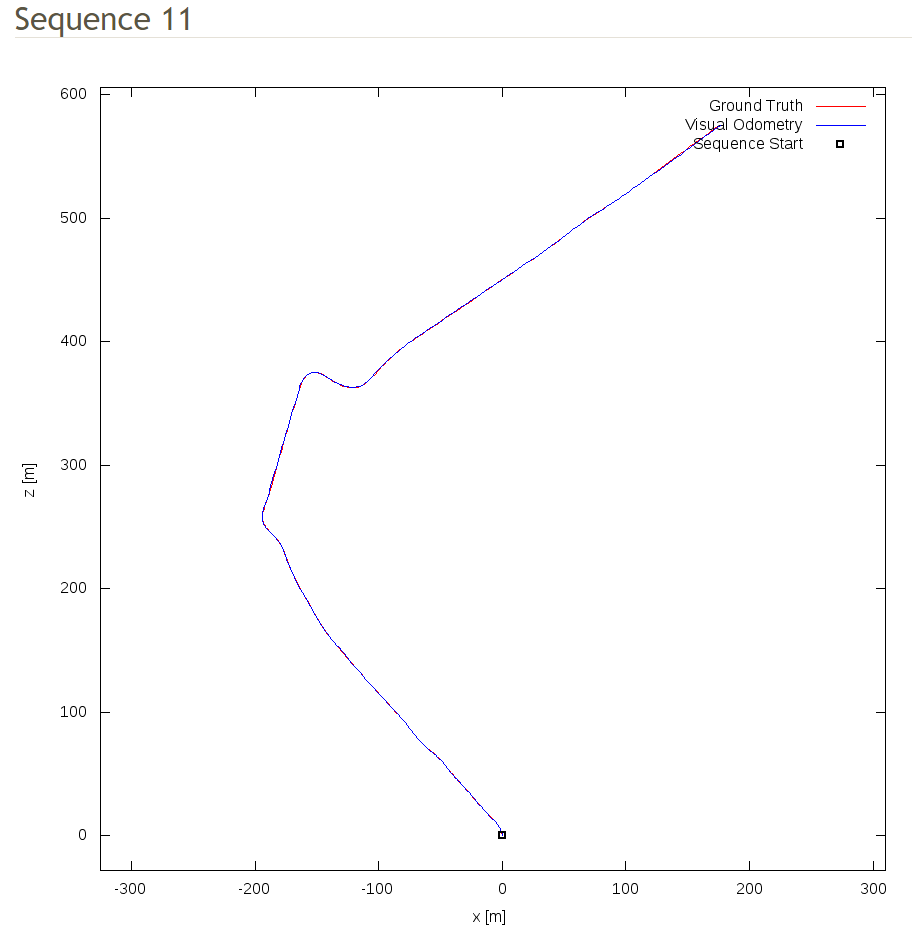
Thank you for your answer! The result was exactly what you said, which the translation has not been matched to the ground truth. My result is shown below, blue figure is what I get from KITTI Odometry poses dataset, while red figure was the predictions drawn by taking the first pose from each snippets: I am not sure if the inverse operation was done in right way, and now I do not have any idea of rescaling the translation. If you have any idea, please let me know. |


|
I have encountered a problem similar to this. As I wanna use this network to predict ego-pose in SLAM or real robot system, I need to convert the output of posenet to the 'groundtruth', while I cannot get the scale_factor. |
|
You can't. The whole pose measuring is unsupervised and untied to reality. Taht means that when training, everything is up to a particular scale that is not even necessarily consistent throughout the test set. The only constraint during training is that depth and pose are consistent so that warping minimizes the photometric error. What you can do is to know your displacement magnitude from an external source, e.g. IMU or speed from wheels, or you can know some depth points, with a Lidar and then compare it to the depth from the network that was used with pose network. The scale factor real depth/estimated depth is the same as real displacement magnitude/estimated displacement magnitude. |
|
@anuragranj Hi, how can you plot the full trajectory ? it looks impressive. |
|
Hi, Can you share the code of the visual pose prediction? |
|
@anuragranj Hi, Can you share the code of the visual pose prediction? |
Hello,
I am a student who just very new to every contents written in this project (Python, PyTorch, CNN, movement estimation, etc.) and I want to learn basics by replicating your work :).
I could replicate most of your work but now I got stuck doing visualize the prediction poses and then compare to the KITTI ground truth poses data as similar as shown below:
I could draw the ground truth map with no problems. How your code as well as explained in the paper seem using 5-frame snippets for prediction, therefore the output final_poses has size [pics_number, frame_number, 3, 4] while KITTI ground truth poses data only has size [pics_number, 3, 4]. I don't know how to deal with this array to draw visual odometry map so could you please show me how to do it?
One more thing, sorry for my bad English but in file times.txt got from downloading the KITTI odometry data set which explained : "Timestamps for each of the synchronized image pairs in seconds", is it the time between frames?
Please correct me if I am wrong at any point.
Thank you very much!
The text was updated successfully, but these errors were encountered: