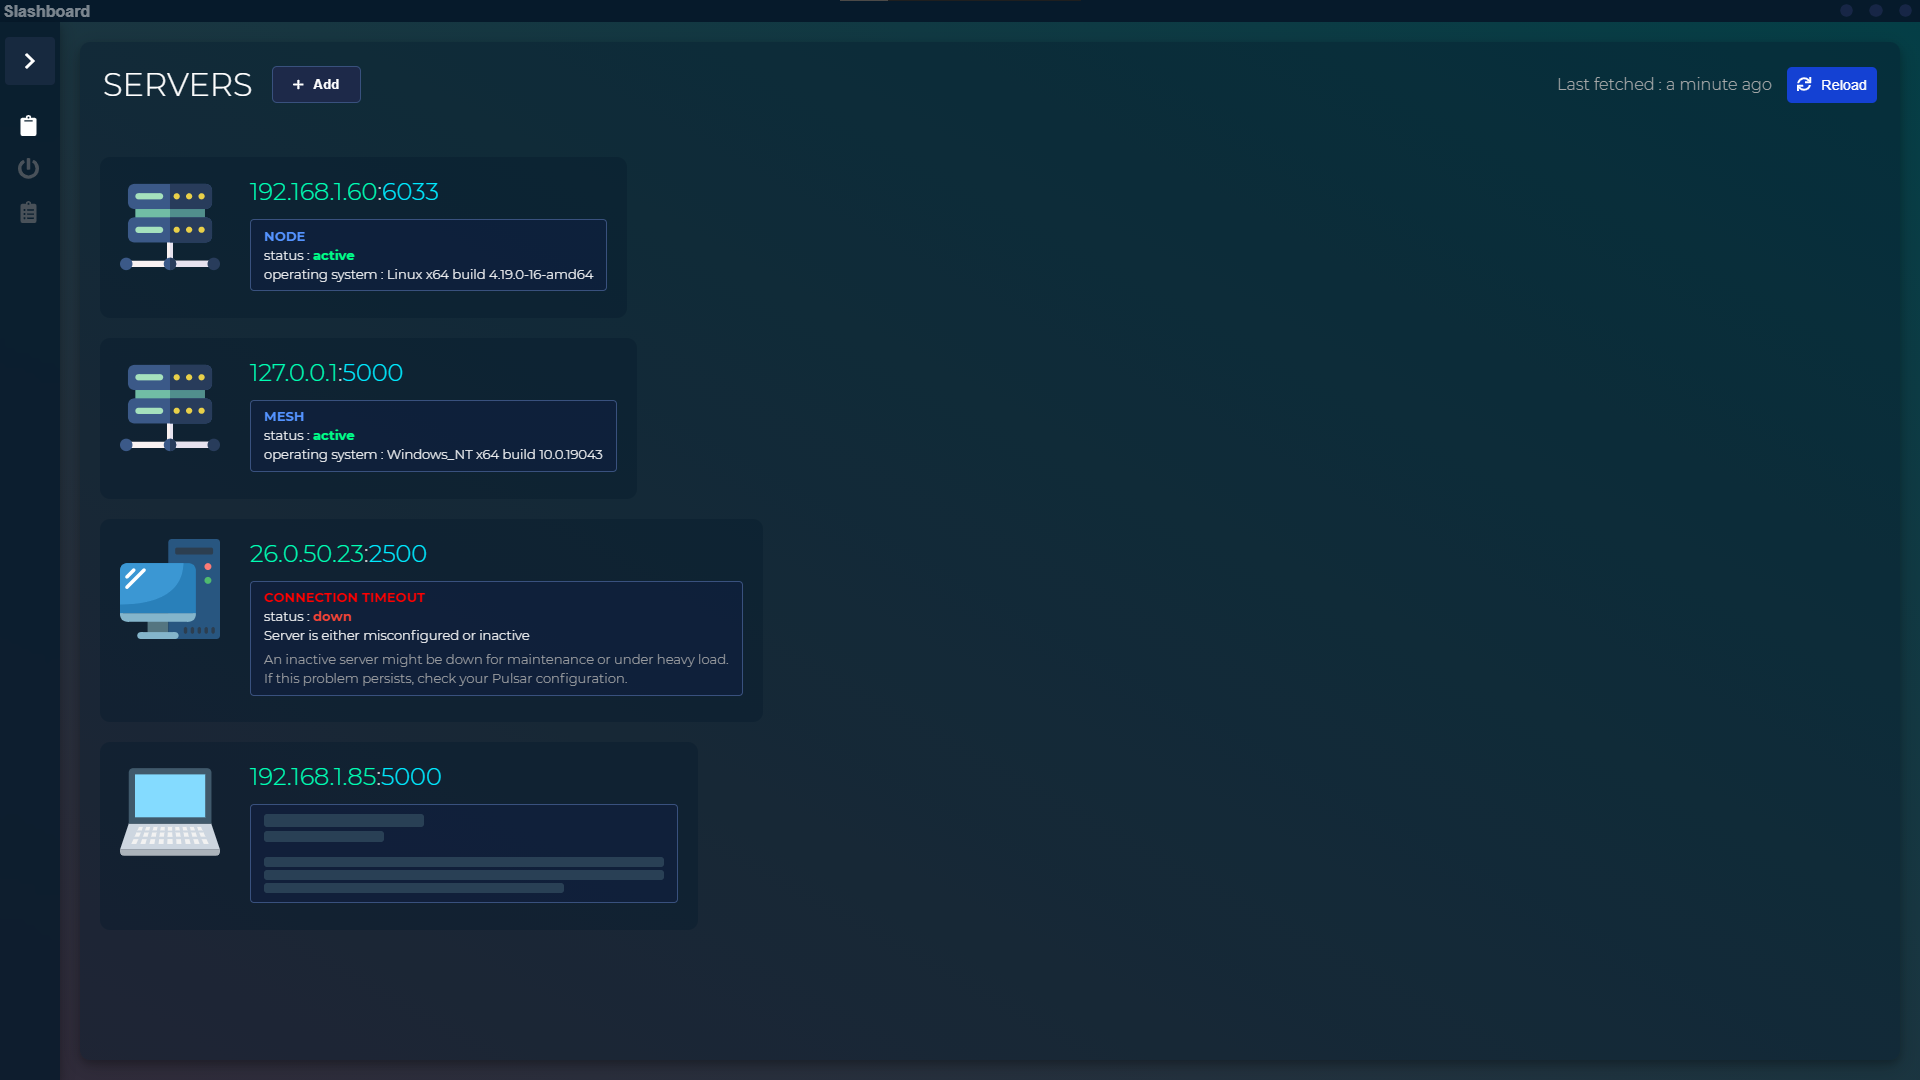
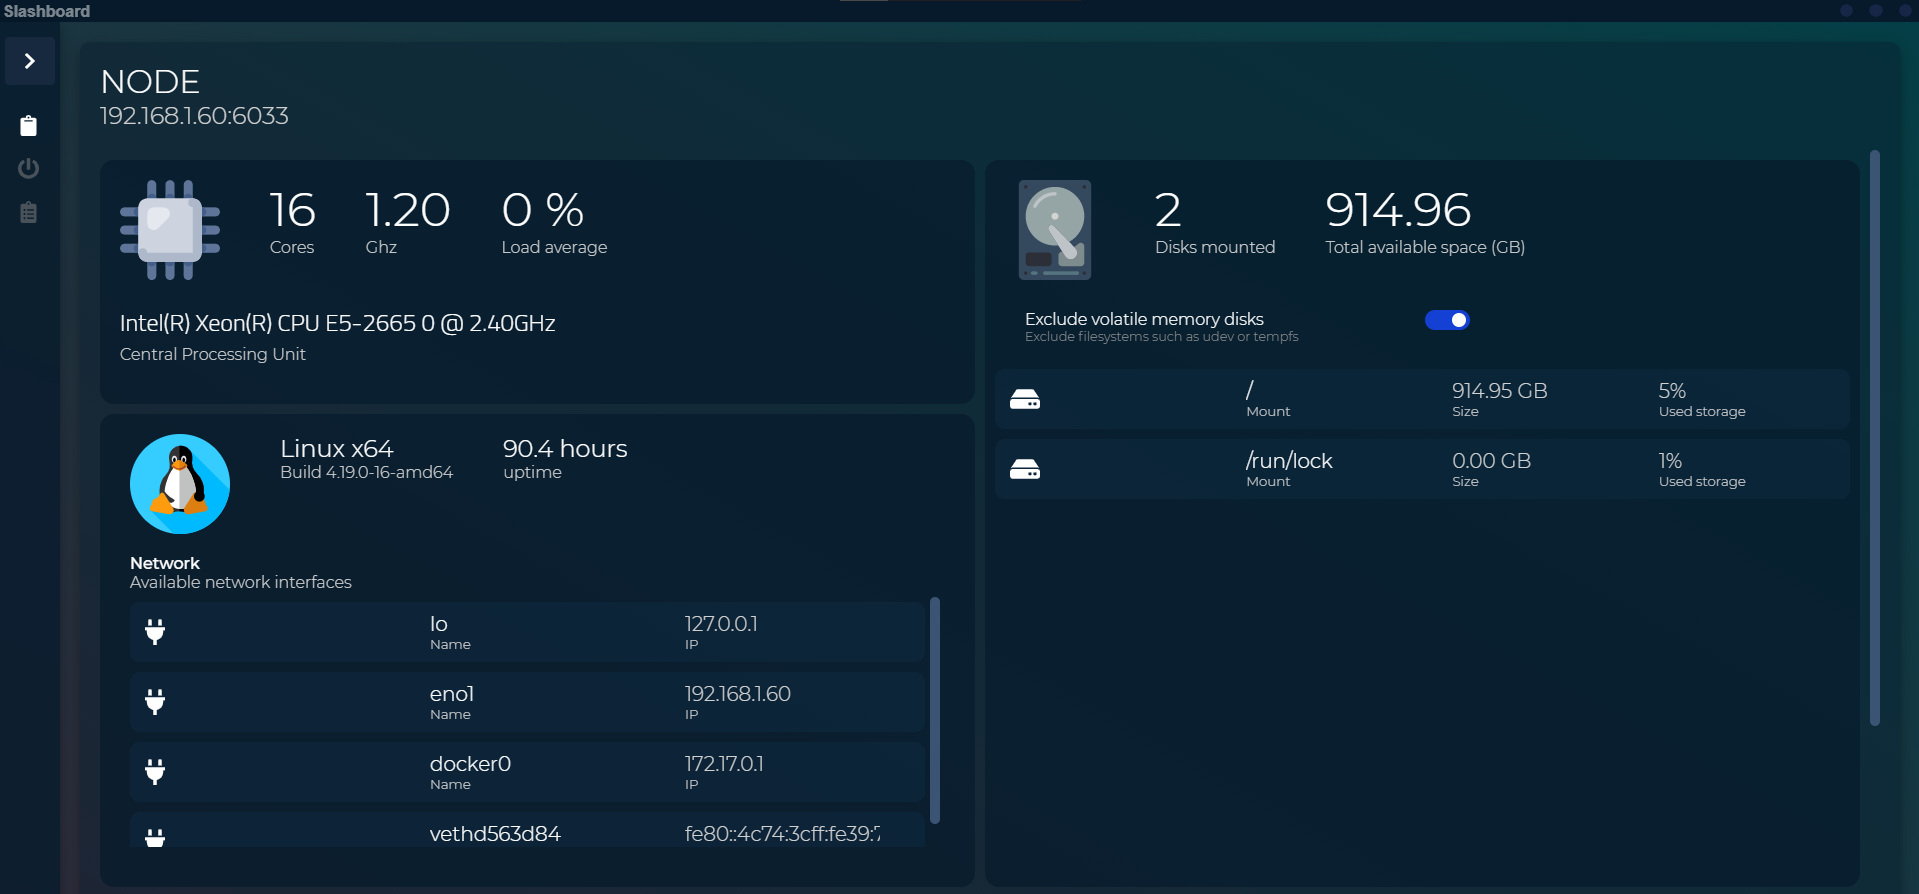
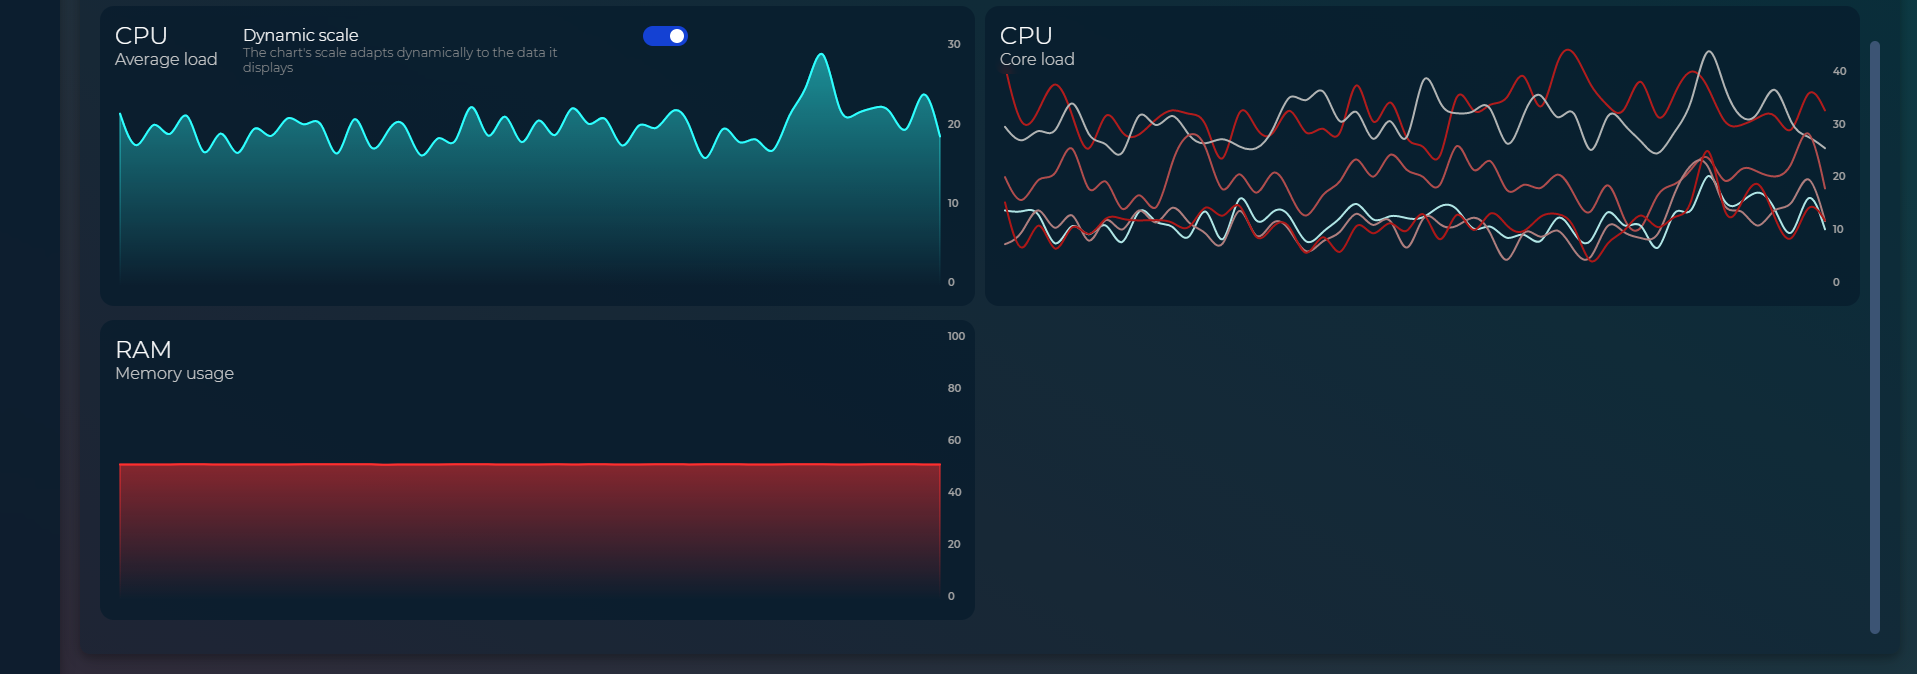
A simple and convenient way to monitor the activity and performance of your servers. Probably more ergonomic than your average terminal htop.
Built using Electron and React.
-
Download the latest release of the desktop client for your OS
-
Install Slashboard-Pulsar on your server, a lightweight node js server which will be used to retrieve the data and display it on the dashboard.
Once set up, you will probably need to forward a port in order to make your server accessible from anywhere on the internet. See Pulsar's documentation for more info.
When you eventually know your server's IP, port and key (again, see Pulsar's readme), click "add" (or "Let's get started" if you haven't added any servers yet) and fill in the required fields.
Click the server's icon to access its dashboard view, hover it to display the "refresh", "edit" and "delete" buttons.


