This is the source code used to visualize activity in the open source github "data" community, covering most of the popular database management systems and data processing frameworks like Hadoop and Spark. Analysis included more than 100 different repositories and more than 1.5 million commits. Here is the video generated by this code:
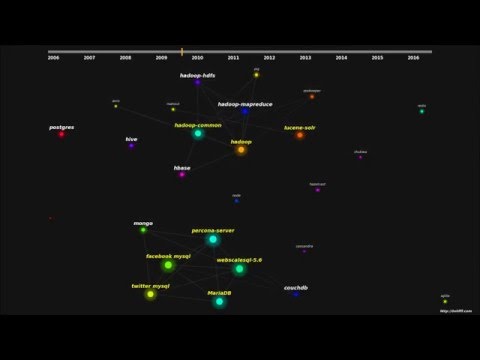
You can find the meaning of nodes, links and other interesting observations in the video description on youtube.
Released under the Apache 2 license.
Enjoy!